"Everyone has a plan 'till they get punched in the mouth" - Mike Tyson

October 28, 2013

Making a case for housing plays

You're probably wondering why housing stocks and why do I like them now.  Let's go through my methodology.

1) With this turn to lower interest rates, the lower rates plays have been showing a ton of relative strength of late.

2) We know the end of the year is typically the strongest period of the year, and the end of strong years are generally strong.  Therefore we could expect risk-on conditions into year end.

3)  Housing is the most offensive of the low rate play groups.  Also, now the price patterns are there for bottoms in the group.  Check out the Philadelphia Housing Index.


On top of all that, Bloomberg had a tidbit from Warren Buffet on housing last week.

“It’s coming back,” Buffett, 83, said yesterday during an event at the New York Public Library. “Pricing (SPCS20Y%) is better in almost all markets by a reasonable percentage from a few years ago. Housing starts are up somewhat. They still are not where I would regard as an equilibrium point, where they match household formation. 

If you're sold on another leg up in housing, here are some plays that have my interest on a longer term basis.


Other names that could really lead/have led the group include: FNF, USCR, RDN, STCK (recent ipo)

October 16, 2013

The bears' technical take

Studying wave theory and watching CNBC got me all sorts of bearish yesterday (bahaha), so let's take a look at the bears' technical take.  There are plenty of classic arguments to make and I've added reasonable bullish counters where applicable.

Bulls EVERYWHERE:   Yesterday on CNBC seemingly every commentator says the government shutdown / debt ceiling is a buying opportunity.  We know they are buying as every little dip has been bought.  While veteran traders have been making tactical trades around news flow, late bulls are convinced the dips are their golden opportunity to finally get long the markets.

Bullish Counter:  Hedge funds have been wrong all year and are more bearish than they've been all year.  


Diverging breadth and leadership:   Tom McClellan had an excellent piece last week on the significant divergence in new highs. That said, we still have a solid amount of new highs being made.  Maybe it's enough to keep that market going?

Moderate divergences are appearing in the transports, financials and consumer discretionary.  Tech appears to be so strong it may make a new relative high.


Similar deterioration is shown in the S&P 500 % of stocks above the 50 + 200 day SMA.  Also note the deterioration in the % of stocks on a PnF buy signal.


Bullish Counter:  Divergences are a fool's game here, The S&P 500 just broke out of one of the largest bases in it's history.


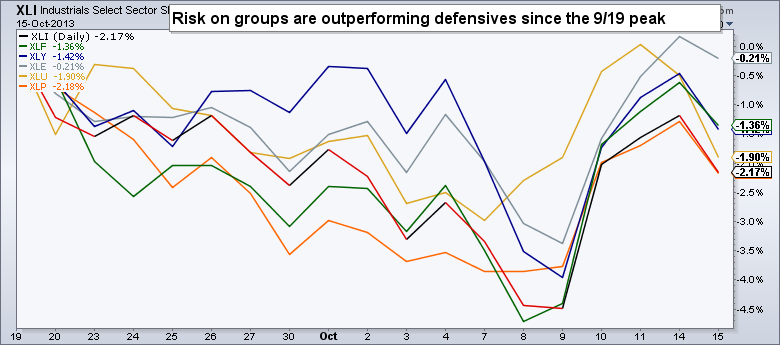
Sector Rotation:   Energy leading generally signals we are near the end of the traditional business cycle.

Bullish Counter:  We are seeing relative weakness in defensive groups like Utilities and Consumer Staples.  This reads as a bullish backdrop.  The bears have no case to make here.


The VIX is breaking out:  The resistance line connecting the Nov 2011 highs and the Nov 2012 highs has been cleared.  We'll feel more confident in this b/o though if it sustains over 20.  


Bullish Counter:  


The IPO market is running hot:  According to Renaissance Capital, in the last month 36 IPO's have priced.  Generally that is a warning of too much equity supply coming out.  Everybody wants to go public now that stocks are making all time highs and 'the coast is clear'.

Bullish counter:  this huge increase in IPO's is logical given the glut created over the last five years.


Wave structure:  So I was about to post that the S&P 500 has currently stopped at the .786 retrace of the move from the September 19th high at 172.76 and the October 9th low of 164.53.

Those who have studied wave theory know the .786 retrace is famous for ending second waves where late bulls and bears are often trapped.

HOWEVER, the 78 retrace just got blown out of the water.  We can't say this is the start of some huge bear market, but it's not unreasonable to believe markets will re-test the October lows.  Wave 2's and B waves have similar sentiment characteristics and the B wave is the best case scenario for bears.


So what do you think?  What makes sense here and what doesn't?   The bearish point that bothers me the most is the sentiment that these dips are late bulls golden opportunity to get in.

At the end of the day, these are all little more than talking points for individual traders and investors.  If there is one thing this year's rally has proven, it's you must just manage your stocks when applicable.  Why would that change in the seasonally strongest time of the year?  


October 14, 2013

Gold Miners are kicked out of top groups

10/22 AM EDIT:  I've just been dead wrong here, so I'll just stop commenting on it.  Defensives didn't bother rallying until post debt deal.  Now, they are all climbing the relative strength rankings.

Some great looking setups popped up across the gold miners in the last few weeks.  I lauded them as a top group, but I jumped the gun.  While the June lows have held thus far, we're looking for the best groups in the market.  Also, numerous bottom reversal setups have been invalidated.

With all of that said, a defensive group weakening is great news for the overall market!

I'm not seeing any other obvious top groups out there.  The same key themes are still in play:  networking, alternative energy, energy and applications/Software-as-Service

One group worth eyeing is the industrial metal miners.  Some favorites at this point include US Steel, Cliff's Natural Resources and Walter Energy.

October 06, 2013

High conviction short idea: iRobot

IRBT has caught the attention of plenty of investors in 2013 with it's meteoric rise from the high teens to nearly 40.  However, the technicals are cracking at a major resistance level.  Price appears headed for a significant decline.

The current intermediate pattern in play is this bullish bat harmonic.  The potential reversal zone (where we can look to buy it) is around the April gap at 26.  This can serve as our downside target.  Note this idea is invalidated over the September highs.


We can see relative strength and momentum have clearly diverged on this last push higher.


Zooming out to the all time IRBT chart.   As noted on the chart, bats tend to occur at critical levels. 


For more ideas you can follow on twitter @a_jackson8  or stocktwits.com @a_jackson

Reminder:

All ideas shown on this blog represent the authors opinion based on the data available.