"Everyone has a plan 'till they get punched in the mouth" - Mike Tyson

February 28, 2015

Rotation Report: Pigsty

It's amazing how sentiment turns so quickly.  For all intents and purposes, everybody is counting the NASDAQ 2000 high as 'in the bag'.  Often times, when i'm trading a stock with an obvious target that everybody is watching, the market either overshoots or comes short of the target.  We're seeing compelling evidence the market is pretty tired here and may come up short.  

Last week formed doji weeks across the major indices and in groups like biotech, financials (two weeks in a row), housing, retail, hotels, software.  Needless to say, we're watching last week's ranges like hawks and it appears the upside momentum is gone (more on that shortly.)

Specialty Retail has been a strong leading group all year.  Note how the weekly candles have gotten smaller and smaller.  The upside momentum is gone.  We're on pullback watch.  


This same thing is occurring in broad market indices like the S&P 500.


This is occurring while volatility is showing a lot of complacency.  It's a perfect recipe for raising cash from long side winners and shifting swing focus to the short side IMO.


Sector Spotlight: Transports

The Transports ETF is also showing that similar pattern of candles becoming increasingly smaller.  Notably, this group failed to confirm the indice's fresh highs.


One group showing particular weakness last week was the railroads as they broke an inside week lower.  The 1200 level will be pretty key this week.


Airlines are looking interesting.  It's a potential wedge or head and shoulders top.  The lower support line around 245 will tell the tale.


The safety trade

Utilities relative strength is testing trend support.  Short term out-performance by the utes seems likely here.
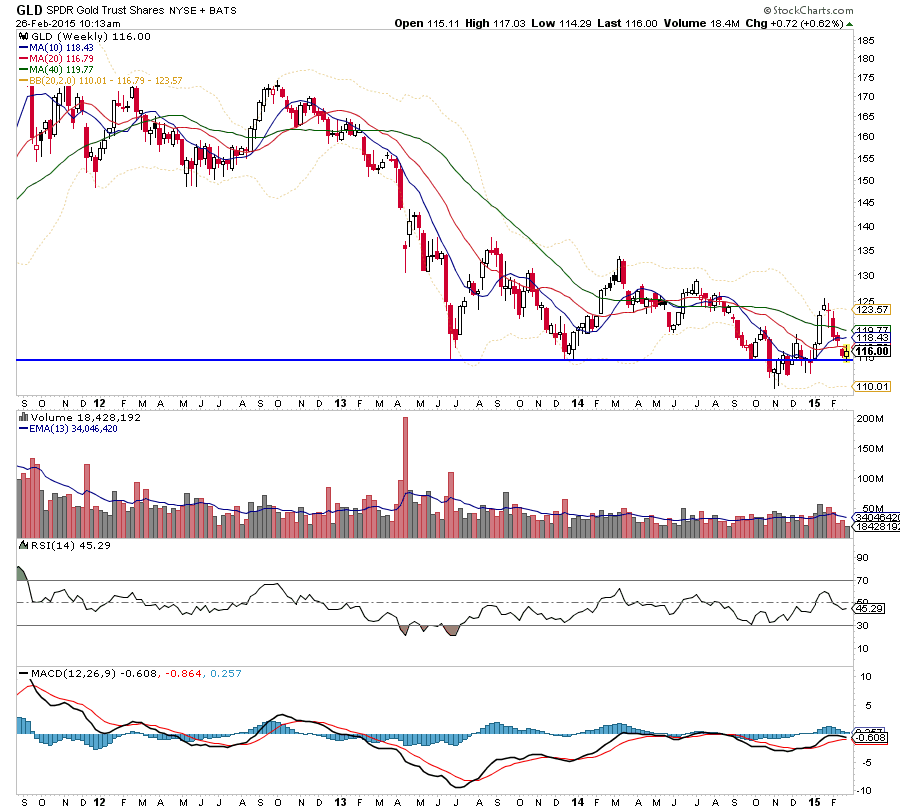
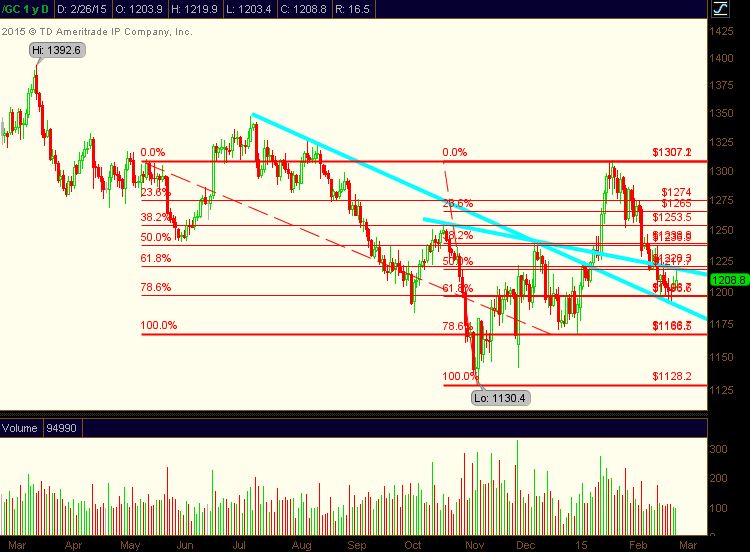


Soft Drinks broke higher out of a multi month wedge.  Will it stick?  Does it signal something about rates headed back lower near term?


Some groups to hunt on a pull-back: aerospace, fertilizers, cloud computing, travel, building materials, security software, biotech.


Commodities


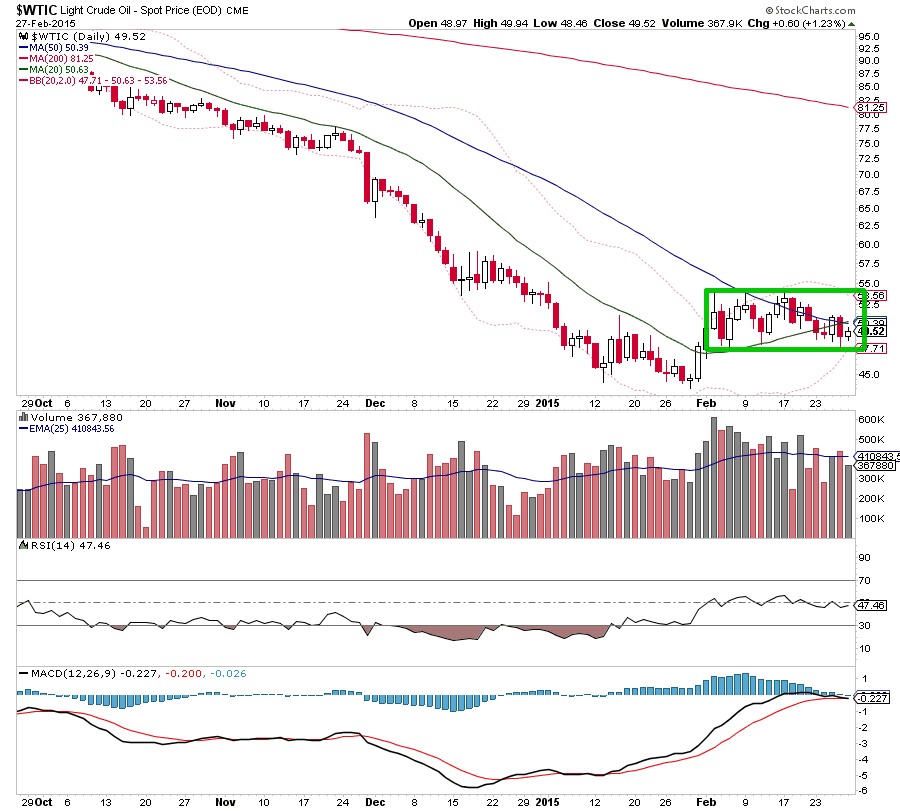
The crowd expects oil to fall hard.  It's hard for anything to break down with sentiment like that.  Especially when price is range-bound like it is now. 


The Agriculture ETF formed bullish divergences on this new low.  


This while wheat and corn refused to break lower to end the week.


Thanks for reading!

February 27, 2015

Is it time to buy gold, again?

Gold has been a major topic of discussion thus far in 2015. We saw Gold prices make a violent move up at the beginning of the year only to fall just as quickly in February. It feels like Gold has been in a bear market for years and years, but amazingly, it’s been fairly stable for the last year and a half.
To get a better idea of what is happening with gold prices, let’s look at both the GOLD ETF (GLD), followed by Gold Futures (GC).
Zooming out on the GLD chart, we see a major false breakdown. Now, price is back at the key support zone. The 114ish support area has held as it did in June 2013 as well as January and October 2014. So if one were looking to get long, they could do so versus ~114, ~112 or ~110, depending upon risk tolerance. Upside target zones would depend on intentions and timeframes but some levels worth noting are 119, 125 and 138.
Gold (GLD) Chart
gld gold etf price chart_basing pattern_2013-2015
It is also worth noting that although Gold prices suffered a sharp recent drop, momentum on a weekly time frame is vastly improved from the other times it touched support.
The major support level also coincides with the 78% retracement of the advance off the lows. Retracements this deep are a characteristic common of first waves in Elliott Wave Theory. Is this a new first wave out of a head and shoulders pattern?
Gold Futures (GC) Chart
gold futures price chart_gc_2014-2015
Also noticeable is how the various Fibonacci retracement levels from the absolute low and the right shoulder low line up around 1200, 1220, and 1240. This is a harmonious market!
I am beginning to see some signs of a potential bottom here in Gold prices and perhaps a great area to take a shot on the long side with a reduced amount of risk.
Even if Gold is going to break down further, it seems logical that we would see a bounce at such a key support level.
Do we know the idea will work? No, we never do. And that is why we try to find good risk-reward setups and use stops to minimize risk. 
Thanks for reading!

(Note this post was originally published at See It Market)

February 26, 2015

Dolla' Holla'

The story of the day was the U.S. Dollar breaking out of a 5 week wedge.  Can it go higher from here?  The next couple of days will be telling.

Common sense leads me to believe if the US is the first one off the easy money/ 0 rates boat, we're going to have continued strength until 'deflation' is a problem again.  

What I find interesting is gold.  Here's my latest post on gold. It's at a key support level.


Further Reading from some of the great technicians at See It Market:

The Dollar is in the early stages of a major breakout

But, it's facing some tough resistance

Thanks for reading!

February 25, 2015

A few quick lessons from: The Mental Edge in Trading

Jason Williams' book 'The Mental Edge in Trading' is fairly unknown and severely under-rated in trading circles. Frankly, if you're a newer investor and ready to be completely honest with yourself, this is THE book to get a very quick read on your own flaws and how to improve your trading.

Here's a list of a few notable insights from the book. Note these are my notes and not quotes.

To determine optimal risk tolerance, start trading small and slowly increase size

Don’t focus on dollar gains, instead focus on profit goals

Over-trading is a bottomless pit of losses

The peripheral damage from one bad trade often masks itself as other problems

Always ask if you’re showing the market enough respect

Strong emotional responses are always counterproductive
  • elite traders notice their emotions sparking

Results of being too anxious:
  • over-trading
  • having too many positions
  • taking a trade before it’s signal (anticipating the signal)
  • trading poor markets trying to nail a heroic rebound trade

Enjoy being a trader regardless of your performance.

Thanks for reading!

February 22, 2015

Top Trading Links

Check out the latest version of my weekly link fest over at See It Market.  If you're not familiar, I just want to keep up with the major happenings in the markets while they are still actionable, make us all better traders and stimulate thought for investors!

Also @abnormalreturns put together a helluva Sunday linkfest with reads for days!

Have a great Sunday!


February 21, 2015

Rotation Report: Grex-in

Finally, a short term resolution was reached in Greece.  That played out very oddly, didn't it?  

The market did a fabulous job working off some greed last week, though we're still running pretty hot.  With the late week strength, we're quickly approaching measured move targets off of S&P 500 and Nasdaq 100 bases.  All of a sudden, signs of strength are everywhere.  It's getting pretty hard to doubt the rally.  Sooo, how many bears throw in the towel?  Let's dig in!

Indices

The Nasdaq 100 approaches it's measured move target roughly 2% higher.


aaaand the small caps are starting to break this upper boundary.  

Indicators

The NYSE dashboard is looking good with all indicators hitting fresh highs.


Small caps volatility is testing long term support.  It'll be a meaningful week or two in the small caps for sure.  Yeah, yeah you can't chart the VIX etc.  Note this level is also the Q4 low.


The stock-bond ratio broke to a higher high and broke the falling boundary line.  The next test is the powerful resistance level in the 33s.  


Group Action

Momentum is picking up in Consumer Discretionary, Aerospace & Defense, Materials, Healthcare and Tech.  What's not to like?  I mean literally, it's becoming harder to find groups not to like which is the polar opposite of 3 weeks ago!

The biotech group is very interesting right now.  The strength is still there and some of the individual price action is incredible.  Since the 50 day moving average test at the beginning of the month, the broad more small/mid cap focused XBI has outpaced the large cap focused IBB.

Recent leader AGIO has what looks to be a head and shoulders top setup.  Let's see how this resolves.


The XBI to IBB ratio is testing long term resistance.  Is the biotech space about to go bonkers near-term?  The conditions are present, but who knows.


Real Estate is starting to base out at the 10 week moving average.  It's time to look long if you're going to!


KOL broke above the falling 50D MA Friday.  There's a lot of room to run here.


Commodities

DBA broke a bearish pennant mid-week.  Downside momentum has slowed and the ag stocks are still trading well.  Something doesn't jive here, but the space is still worth eyeing IMO.  [Who am I kidding, I eye everything regardless ;) ]


Lumber tried and failed to break this monster wedge.  This week seems important


The way gold has acted since the 1300 test has been and remains pretty telling risk-on sign.  


Bonds

TIP found some buyers at long time trend support.  Mid-term government bond duration ETF IEF looks healthy as can be testing a pivot level.  Time to get long?


Overseas

The biggest break of the week was in Japan as it curls the bollinger band higher.


The world index hit 52 week highs Friday as it continues to move out of it's base.


European Financials hinted at the Greek Resolution mid-week with this monster breakout.  It's funny how things play out.  Let's see how it handles the 200D MA and December high area.


Thanks for reading!

February 15, 2015

Rotation Report: Dead Presidents

The bulls reeled in suitcases of dead presidents while slow to adapt traders continue to die off.  The bullish blog posts are flowing and rightfully so.  In the last two weeks, vast waves of change have altered the market picture.  Now, the defensive groups are testing support areas and we're getting hot readings from various indicators....but, the market has made it's intentions clear and it's best to run with the bulls until the market proves otherwise.  

A quick recap

 The monstrous wedge break in the Nasdaq 100 led the market rip. 


Note the Small Caps are testing major resistance


VIX finally appears broken as it took out the major wedge and the prior low.


Group Action

Energy has reached the top of the post-thanksgiving range.  


Utilities relative strength broke the prior low as it approaches trend support.  The damage here is astounding.  We're getting awfully close to trend support that might provide a bounce.


Real Estate relative to Tech is testing the old breakout level.  This happening while real estate hovers over the 50 day moving average.


The internet index broke out of this wedge we've been watching all year.  If it sticks, bears should just go hibernate .


The spin-off ETF popped above year long resistance.  Can it continue?  It sure looks like financial engineering is another huge theme this year.  For more information, here's the Guggenheim info page.


The stock bond ratio is awful close to trend resistance.  The yield chase trade isn't dead, is it?


The consumer ratio is testing cloud resistance.  Luckily it's a razor thin cloud and shouldn't be too much of an obstacle.  It appears near term risk-off action will be another opportunity to get long.


Market Indicators

Vol term structure is showing no fear in the market all of a sudden.  WTF


The NYSE dashboard had a nice week and action is quite healthy across the board.


Once again the stock only advance decline line is above the upper bollinger band.  The persistent strength is impressive, but like last week, this may signal we need to take another short term rest, at least from a breadth standpoint.


Interestingly, SPY short interest dropped sharply throughout the sideways correction.  Is that just a function of year end tidying of positions?  Honestly, I have no clue.  So let's look further..

chart courtesy of schaeffersresearch.com
Over the past two years, sharp drops in the SPY short interest ratio actually coincided with bottoms.  I never would've figured that before looking at the data.

chart courtesy of schaeffersresearch.com

Commodities

The anti-dollar trade is coming back into relevance here.  I wrote on a whole bunch of related ideas a couple of weeks ago.  The agriculture commodities remain favorite long ideas.

Is that a head and shoulders bottom in corn?


Nat Gas is testing it's 3 month downtrend.  Price is making a higher low, maybe this bull momo divergence will start to matter.


Overseas

The world index broke over it's five month resistance line.  Will it finally get going?  Momentum supports a continued move higher.  This makes for some real nice U.S. breakout confirmation.


Poland is testing key short term resistance.  The news flow from Russia and Greece will probably play a role.  Also note the 50 MA nearby.  


To summarize:

Just for emphasis, there might be some short term rest needed, but stocks are acting right and we're seeing everything bulls want to see as via Drasko Kovrlija  

On top of that, the dollar appears is at key resistance, providing a possible boost to asset prices as Chris Kimble writes over at See It Market 

Thanks for reading, have a great week!

Reminder:

All ideas shown on this blog represent the authors opinion based on the data available.