"Everyone has a plan 'till they get punched in the mouth" - Mike Tyson

December 23, 2013

Chart porn

Some MACRO charts of note

Gulf States - Basically a middle east ETF.  for more details click here


Gasoline - a small bull H&S has broken out as it makes a run at key trendlines above.


CRB Index - regained a key support line.  This adds a lot of significance to the line.  Taper signaling a decent inflation rate ahead??


Groups to watch

GEX - alternative energy with a spectacular consolidation.  This includes solars and things like CREE, TSLA


XNG - nice push past resistance.  An explosive look.  here's a link to the components 


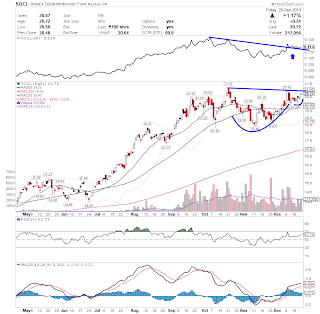
SOCL - a great cup with handle look while relative strength has already broken out


Fresh setups, hot breakouts


HBIO - a small biotech breaking a MASSIVE base  A double> triple+ over time?  My favorite fresh breakout out there and it's not close.


HIL - theres a great swing long opportunity here


EGAN - a winning net stock in 2013 has dipped under the 200D.  A strong move over has our interest versus channel lows

SFY- breakout re-test

 CLFD - Networking is picking it up in a big way of late.  No sellers in this stock all year.  A top pick here


AL - the aero cycle is in full force.  This has based nicely after the IPO breakout offering a low risk speculation point for longer term players.


 MWW - small staffing stocks are going CRAZY of late.  This fresh breakout targets 9


 NAT - the shippers have been big gainers, this is one of the best set up charts in the group.  This should see 10 quickly.  Probably has much more in it.


 MTW - I love the tight coil break here.  I own it and am looking for a 30's in 2014.


 JNS - hot group, won't be shocked if this trades 20 a year from now


 CPE - The dip has been bought.  Looks ready to test the recent highs and could lead to much more upside


DSPG - leaving a 4 year base in a big way, likely has at least 35% upside left


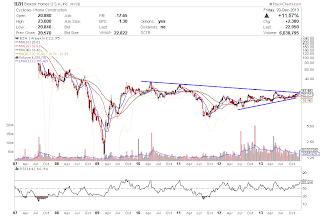
 BZH - breaking a 4 year gradual resistance line; this is poised for major gains as are others in the housing sector (hov, spf to name a couple)


MLNX - appears to be turning the corner exiting this long term falling wedge.


INSM - a key bounce at support this week.  This all coming at a major breakout point.


December 12, 2013

Quick thoughts on sentiment and seasonality

Everybody is anticipating this smooth Santa Claus rally into years end.  We may eventually get that, but this down wave could be MUCH stronger than most think, because we're all content.

Many are looking for 'next yr's big winners' in this yr's losers(including myself).  That strategy has to be less effective when everyone is bullish, right?  Or does this mix of sentiment and fundamentals just suggest the big winners aren't going to come from the most obvious areas like gold miners etc?

Speaking of this year's losers, it's again proven hard to time an entry into those.  There are just people selling for tax loss purposes everywhere into ANY strength.  Just look at coals like ANR.  It ripped a whole dollar on Monday (12/9) and it's already reached it's previous low.

While everybody is going to be clamoring about the January barometer, it's not as statistically useful in mid-term election years.  According to the folks at Trader's Almanac, 10 of the last 16 MTE years have followed January's direction.  On top of that, the first five days in January have told us nothing(8/16) in MTE years.

November 25, 2013

Chart of the day

The Biotech SPDR ETF is rejecting the head and shoulders topping pattern that has formed over the entire fall.  A huge rip isn't a guarantee until the September highs are taken out, but with the clear RSI and relative strength resistance breaks, the odds are definitely in favor of a strong move higher.

Some stocks in the group of note:  ENDP, NPSP, INSM, BCRX, ALNY, IRIX, ILMN, PODD, CBST, HALO, STAA, ACOR


New Investment Idea: ACOR

Accorda Therapeutics has two big things going for it piquing my interest.

First, a nice long term chart is shaping up here.  It's based for the better part of 7 years now with a base range from 18-40.  It's recently formed a falling wedge pattern over the previous 6-7 months after testing all time highs this spring.  A break above the wedge sets this thing up nicely for a test of all time highs and potentially a monster run to the 60's and beyond. 


Accorda has a real interesting and deep product pipeline.  They have three potentially real powerful drugs here that could multiply their market cap.  Check out this video of  the company's founder Ron Cohen and his recent appeared on Mad Money


12/9/13 update: nothing has taken place that changes our view, but this needs more time.

November 21, 2013

Financials re-added to the top industry groups list

The financials have really proven themselves over the last ten trading days or so.  Let's start with the clear leader of the group JP Morgan.  

Remember how America completely trolled #askjpm for two days last week?  Well the folks at JP are getting the last laugh, and they'll be laughing for awhile.  

There was a 6 month head and shoulders top in place, that has failed to materialize to the downside.  Last week JPM broke resistance and has already cleared to new 52 week highs.  This is clearly THE leader of the group.


Now lets look at XLF itself.

This has had just a stellar smooth uptrend (price on bottom) and during the recent 4 month consolidation, it never tested long term support.
 

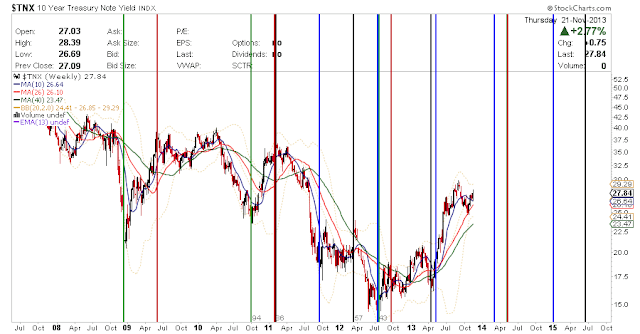
The most important chart out there is the 10 year treasury yield.  We can all see that clear as day topping pattern.  Check out the second chart that really shows the significance of these levels.  


If yields can break above these key levels then all sorts of regional banks, savings and loans and investment managers will quickly become momo stocks.  Some quality names of note include: TROW, FNGN, DHIL, BKCC, RJF, BOFI.

I'm a big fan of the stick with what you know methodology.  Maybe that small bank in your town is a publicly traded and just maybe it's ready to rip 30-70%.  It's definitely worth finding out right now as there are huge gains to be had still across the board.


November 18, 2013

ideas wrap up 11/14/13

This is just a list of some of my favorite ideas I threw on my twitter/stocktwits stream last Thursday.  They all still stand and look attractive.


Macro charts of importance

The ten year yield chart is at a critical juncture.  A massive H&S top is forming.  Either way this pattern breaks will tell us where rates are going in 2014.  This is the most important chart in the US markets bar none.  The colored lines are different cycle projections looking for key points in time in the future.  


Sentiment is very bullish here.  The shifting of the lower band suggests this can get much more frothy before a significant pullback occurs.


This stock bond ratio keeps pushing higher.  It is acting like it wants the 2007 high.


Breadth is mixed, but this chart is so clean I'll stick with it as a key.  Thus far the up trend remains.


XBI is showing some strength as it refuses to break down from a H&S top.  Over 125-127 we would see more wildly bullish action in biotechs to end the year.


November 07, 2013

Quick Trade idea

GNK had earnings last night.  They beat and it's ripping in the pre-market.  The chart shows a beaut of a daily head and shoulders bottom.  We could be aggressive and get long now versus that 2.76 low, but the pattern is so good we could just wait for a clear neckline break and target an attempt at the September highs.  Good Trading!

October 28, 2013

Making a case for housing plays

You're probably wondering why housing stocks and why do I like them now.  Let's go through my methodology.

1) With this turn to lower interest rates, the lower rates plays have been showing a ton of relative strength of late.

2) We know the end of the year is typically the strongest period of the year, and the end of strong years are generally strong.  Therefore we could expect risk-on conditions into year end.

3)  Housing is the most offensive of the low rate play groups.  Also, now the price patterns are there for bottoms in the group.  Check out the Philadelphia Housing Index.


On top of all that, Bloomberg had a tidbit from Warren Buffet on housing last week.

“It’s coming back,” Buffett, 83, said yesterday during an event at the New York Public Library. “Pricing (SPCS20Y%) is better in almost all markets by a reasonable percentage from a few years ago. Housing starts are up somewhat. They still are not where I would regard as an equilibrium point, where they match household formation. 

If you're sold on another leg up in housing, here are some plays that have my interest on a longer term basis.


Other names that could really lead/have led the group include: FNF, USCR, RDN, STCK (recent ipo)

October 16, 2013

The bears' technical take

Studying wave theory and watching CNBC got me all sorts of bearish yesterday (bahaha), so let's take a look at the bears' technical take.  There are plenty of classic arguments to make and I've added reasonable bullish counters where applicable.

Bulls EVERYWHERE:   Yesterday on CNBC seemingly every commentator says the government shutdown / debt ceiling is a buying opportunity.  We know they are buying as every little dip has been bought.  While veteran traders have been making tactical trades around news flow, late bulls are convinced the dips are their golden opportunity to finally get long the markets.

Bullish Counter:  Hedge funds have been wrong all year and are more bearish than they've been all year.  


Diverging breadth and leadership:   Tom McClellan had an excellent piece last week on the significant divergence in new highs. That said, we still have a solid amount of new highs being made.  Maybe it's enough to keep that market going?

Moderate divergences are appearing in the transports, financials and consumer discretionary.  Tech appears to be so strong it may make a new relative high.


Similar deterioration is shown in the S&P 500 % of stocks above the 50 + 200 day SMA.  Also note the deterioration in the % of stocks on a PnF buy signal.


Bullish Counter:  Divergences are a fool's game here, The S&P 500 just broke out of one of the largest bases in it's history.


Sector Rotation:   Energy leading generally signals we are near the end of the traditional business cycle.

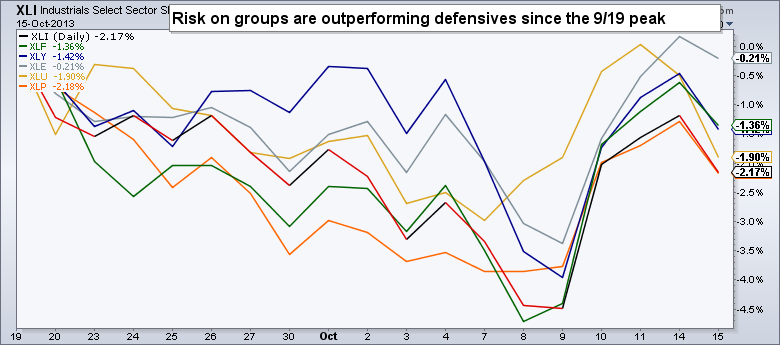
Bullish Counter:  We are seeing relative weakness in defensive groups like Utilities and Consumer Staples.  This reads as a bullish backdrop.  The bears have no case to make here.


The VIX is breaking out:  The resistance line connecting the Nov 2011 highs and the Nov 2012 highs has been cleared.  We'll feel more confident in this b/o though if it sustains over 20.  


Bullish Counter:  


The IPO market is running hot:  According to Renaissance Capital, in the last month 36 IPO's have priced.  Generally that is a warning of too much equity supply coming out.  Everybody wants to go public now that stocks are making all time highs and 'the coast is clear'.

Bullish counter:  this huge increase in IPO's is logical given the glut created over the last five years.


Wave structure:  So I was about to post that the S&P 500 has currently stopped at the .786 retrace of the move from the September 19th high at 172.76 and the October 9th low of 164.53.

Those who have studied wave theory know the .786 retrace is famous for ending second waves where late bulls and bears are often trapped.

HOWEVER, the 78 retrace just got blown out of the water.  We can't say this is the start of some huge bear market, but it's not unreasonable to believe markets will re-test the October lows.  Wave 2's and B waves have similar sentiment characteristics and the B wave is the best case scenario for bears.


So what do you think?  What makes sense here and what doesn't?   The bearish point that bothers me the most is the sentiment that these dips are late bulls golden opportunity to get in.

At the end of the day, these are all little more than talking points for individual traders and investors.  If there is one thing this year's rally has proven, it's you must just manage your stocks when applicable.  Why would that change in the seasonally strongest time of the year?  


Reminder:

All ideas shown on this blog represent the authors opinion based on the data available.