"Everyone has a plan 'till they get punched in the mouth" - Mike Tyson

July 31, 2015

Rotation Report: Macro to Micro

After Facebook's earnings 22 analysts raised price targets.  22.  That is a helluva clear sign the bull's boat is full.  That also shows a clear lack of diversity in opinion, which is a key characteristic of market reversal points.

Remember Amazon's monster earnings pop lasted 10-15 minutes in the open market before fading?  This week, LinkedIn and Twitter's earnings pops lasted all of ten minutes in after hours trading.  Absurd moves are happening and smart money is cashing in immediately.

There are plenty of data and opinions out there that support nit picking bearish arguments.  The main problem with that is the most important argument of all is PRICE.  The major fibonacci extension levels in the S&P 500 and the Dow Industrials continue to cap the markets.  That continues to tell us there is limited upside on a broad market basis.  If those levels break, we can adjust our point of view, but not until then.

Let's hit the charts..

Once again, just like that the market is fearless.


Breadth is starting to come back in the S&P 500.  Note the ratio didn't form a fresh low with the market.


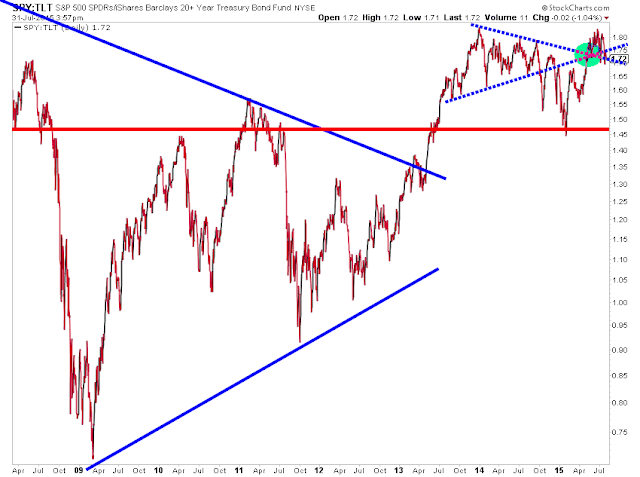
The stock vs bond ratio broke a multi month range lower.  Looks like we can expect bonds to out-perform near term.


Group Action

I've pointed out the action in semi's during the week.  Note the MACD bull cross.  I'm looking to buy weakness early next week for a larger oversold bounce to test the 200 day moving average.  This would be a much higher probability opportunity if the market wasn't so 'fearless'.


The 51.75 area looks pretty solid.  Also note the daily Bollinger Band support at 51.  


Energy tried to reclaim the winter lows and failed.  This group is awful and even worse if it holds new lows.  


Utilities are trying to break clear of resistance.  They'll likely be tied to bonds in the near future.


Can steel bottom out here at the spring lows?


Gold miners are coiling up here.  The left for dead group is showing signs of potential.  


7-10 year treasuries have broken out of head and shoulders bottom.  That said, there is still some resistance to work through


The dollar is the key market driver.  Watch it in the days and weeks ahead.  It seems pretty strong.


Trade 'em well!

July 30, 2015

Solar

stocktwits head man Howard pointed out

Obviously Solar stocks have been hit with the rest of the energy space.  One key thing worth noting is subsidy cuts are coming from the US, to Canada, to the UK.  Or at least that's the talk.

Regardless this is a good thing for the group.  Either the cuts are coming and kill off the weak competition therefore strengthening the industry OR the major players still get the profitability boost of the subsidies.  Anyways, on to the charts..


If this year and a half downtrend in SolarCity breaks, this is the one to own.  It really just depends on the market.

Moving to SunEdison, it's got this mega tailwind from last year's spin-off of it's non-core semi business.


Now after a big run and pull-back off a head and shoulders top, buyers have stepped in at an old pivot in front of the 200 day moving average.  It's also worth noting the market has hit it's breakdown measured move.

Obviously SunEdison is a much better technical buy right now as it's at support, but both stocks are worth consideration as we move through the often volatile fall months.

Trade 'em well!


July 27, 2015

Weekly Post Wrap

I think it's important to bring real life trading issues to the forefront.  Look for more of it in the week's ahead

Trading with your head not right  

Things learned from trading my biggest position in years

Rotation Report - note the part on emerging markets and china.  it's happening.

Top Trading Links was jam packed with goodness

I wrote a stack of analyses on various stocks reporting earnings last week:

Biogen

Amazon

Illumina

Regardless of a correction, bear market or whatever, there are some awesome price structures in the cyber security stocks.

Top Trading Links

What is progress? Progress in education is when you look back and you see things differently. As George Bernard Shaw said “Progress is impossible without change and those who cannot change their minds cannot change anything”.
To be a better market operator, you’ve got to be willing to constantly re-shape (A) how you think and (B) your thoughts. Whether it’s about how the market is acting, how the world works or every our own psychology. Note Ray Dalio for instance. A month ago he was notably bullish on China. Now, as events have unfolded and the market environment has changed, he’s willing to change his mind after taking a beating. Is there egg on his face? Only if you choose to look at it that way.

MARKET INSIGHTS
Ray Dalio on China:
”History has shown that smart investors tend to sell when the government is artificially supporting prices and buy when they are liquidating positions”.
Dana Lyons aka @JLyonsFundMgmt ran an expose on how shockingly poor market breadth is right now:  ‘The thinnest new high in stock market history“.
@KimbleCharting notes the key fibonacci extension in the Dow Industrials. The recent high is going to be a simple tell moving forward:
dow jones price resistance level chart
@IBDinvestors shares how to find IPO winners.
After Monday’s loss, gold miners were as oversold as any time ever on a rolling 5 day basis – via shortsideoflong.com.
Check out @TradingonMark’s Elliott Wave Analysis of oil.
crude oil wave lower prices july 2015
@allstarcharts on long term treasuries:
tlt long term treasuries chart
@hedgopia on corporate bond issuance.
The excesses that took place to fund shale oil/gas projects, for instance, are coming home to roost. Energy bonds that were trading in the 60s and 70s are now trading in the 20s and 30s. All of a sudden, buyers have gone on the sidelines.”

Semiconductors have massively diverged from the market since the ‘M&A’ top in late May. Studies suggest semiconductors and PCs are the new standard by which to measure global economic health. More on this growing concern by @AndrewThrasher

OPERATOR INSIGHTS
Howard Marks on @Ritholtz Masters in Business podcast. My key notes/takeaways:
  • The real success in investing goes to people who achieve a superior understanding of the things going on, why they’re going on and what they mean.
  • If you think the same of everybody else, you’ll behave the same. If you behave the same as everybody else you can’t expect to out-perform.
  • The first job of the money manager is to control risk.
  • We can’t predict, you can prepare …you can’t prepare for everything, we have to do it probabilistically.
“Sometimes, even when you have success, there’s an assumption that that success was based on your process”
“However, with some simple planning and situational awareness, you can be better prepared to make proactive (rather than reactive) investment decisions.” 

RESEARCH & NEWS
Homejoy shuts down after worker classification lawsuits.
Per Gartner, Mobile data growth is expected to grow at a 60% clip in 2015.
Tesla’s future is going to be awesome. Gasoline powered cars are TOAST! by @Ritholtz
The first success in connecting flexible energy devices directly without using wires or circuits.
20 Lessons from 20 successful entrepreneurs.
We’ve heard about the recent soar in euro denominated bonds by US corporations, but nobody mentions we’re only touching 2007 levels.

Thanks for reading!

July 25, 2015

Rotation Report: Not so sexy

The action in the mega cap leaders has just been absurd of late.  For example, take Amazon.  It was already significantly overbought on a weekly time-frame leading into earnings and it just happened to gap up 100 dollars and open 15% above the weekly upper bollinger band (the most since 1999).  You don't see this action all the time.  It's late stage bull market stuff.  But how late?

Chris Kimble notes the recent high in the Dow Industrials is also the 161.8 fibonacci extension from the 2007-2009 range.  That index joins the S&P 500 with the same extension level peak.  These markets are in really in sync.

Heading into next week we have two scenarios setting up.  Scenario A, we bounce soon around this market wide pivot zone.  Scenario B, the market completely shits the bed.  Let's figure out which is more likely.

The S&P 500 weekly chart looks like a disaster with a bearish engulfing week.  I think that's just a timing matter that just scares people this weekend.


But then we look at the daily chart and there is plenty for bulls to work with if they want to buy come Monday or even on further weakness.


Market Measure

Of course breadth is 'scary' divergent.

Dana Lyons did a great job explaining how breadth has massively deteriorated of late.

Looking at the NYSE breadth dashboard, it's leading the market to new lows.


Everything market measure wise is getting scary, The difference between now and a month ago is there is no 'in your face situation' like a Greece that's soon to be resolved.  This action is just coming from weak market internals and poor commentary from corporations.

Even with all this concerning action, there's not much fear in the market per vol term structure.  


The VIX is only trading with a 13 handle.  


This all suggests we should be careful.  Especially with limited upside capped by the major Fibonacci extension levels in the Dow and S&P 500.

For a year I've harped on the major tops in bond market risk appetite.  I've been wrong in thinking it's a coincidental indicator and forced fit it into views particularly last fall..  However, now we have a lower high breaking down that could weigh heavily on the market.


Group Action

Materials have exceeded the downside measured move as we've reached a pretty important bounce zone.


Last week, I wrote on this massive head and shoulders top in Intel.  Why does this matter?  It's 19% of semiconductor ETF SMH.  Now it's broken down and has also lost trend support from 2012.  That's a BIG top.  It's naturally tempting to step into the group, but man this will be an anchor for the group for months.


Random question, why does this XLP chart look like the NASDAQ 100?  Anyways it looks great if it can hold.


The financials have struggled to break above the upper boundary line.  The trend is still strongly higher, the group is also expected to have the second best EPS growth in 2H 2015.  It'll be very interesting to watch this group moving forward.


Other Markets

Friday was the clearest bearish reversal candle we've seen in the Shanghai July rally.  In my book, FXP is the best ETF way to short China.  We could definitely see a test of the low area in the next week or two.


The DAX has reached a moving average confluence.  Even if that were to give way, there is a strong chance this is a bottoming base that's been building since May.


Emerging Markets via EEM is on verge of a major breakdown.  That would be a MONSTER headwind for the market.  I'm looking hard at ultra short emerging market ETFs.


Oil is approaching some new notable support levels. 


While price in the major indices suggest support is near, the underlying action is suggesting there is a very real chance the market shits the bed, eventually.  We've seen plenty of later stage bull market action across the board.  Whether we bounce first and continue to loiter back near 2120 for awhile is anybodies guess.  China could be a real drag on the market and we'll know if that bearish reversal candle confirms by the Monday open.

Trade 'em well!

July 23, 2015

FantastHACK long term action

Here's a look at the lesser known HACK holdings with absurd chart action.  My favorite is ZIXI.  I own it.  I wish I owned WYY.  SAIC looks incredible on a long term time frame.  VDSI is violating US sanctions and won't break down.   Last year IMPV shed two thirds of it's value in a month.  It's now recovered all losses and then some.  That one isn't done.

Luckily we have a market that's allowing plenty of opportunity.

Pick your timeframe and style.  Manage your risk.


Trade 'em well!

July 22, 2015

Thinking straight II

It's hard as hell to think clearly all the time in markets.  Yesterday, I laid out a real life example of emotions messing with your trading.  Now let's talk about when your positions can mess with your emotions.

This post from Base Hit Investing a few months ago got me thinking about sizing strategies.  Since then I've tried to adjust my approach to have less ideas, better quality of ideas and bigger size behind those ideas.  

My first absolute favorite idea since then has been short oil via SCO and DWTI.  Why?  Well the 200 day moving average finally caught up to prices last month and it's a bear market.  That's not what this is about though...this is about us(me) learning from this process.

On a percent of portfolio basis, this is 2x as large as my prior largest position in the last 3 years at  roughly 55%.  I'll tell ya, from a psychological perspective it's felt like 80-90% of my accounts.

I decided to try to position trade it by holding the SCO (~25%) and flipping in and out of DWTI
(~30%) to relieve some of that anxiety.  That worked excellently for awhile, until last Friday.  It might have just been how the market was trading, i'm not really sure.  If you follow me on twitter you've probably noticed a cluster of odd messages about oil lately starting around Thursday-Friday.  That large position size drove me to some absurd paranoia.

Yesterday, there was a beautifully timed squeeze and in an attempt to manage risk, I threw in the towel on a large portion of the trade and reduced it to a psychologically comfortable 19% of assets.

Of course, that rip was nothing and oil is hitting new multi-month lows today.  Sigh...maybe there will be another rip to beef the position back up.  Maybe not, but if things keep working on the downside there will be another opportunity to beef up.

A few other things worth noting:

  • This sizing really unearths beliefs and convictions.  
  • It may have made my reactions to stops in other positions slower
  • The thing i'm really noticing is how even just checking in on prices every couple of hours made it seem like I was screen watching non-stop all day.  

Undoubtedly every time I review this sequence, there will be more to learn farther down the road.  I'll be sure to share!

In the short term, the good news is i'm about to have a hella lift and i'm going to dominate in my basketball league tonight.

Trade 'em well!

July 21, 2015

Thinking straight

Over the weekend I had some relationship issues pop up. (involving me acting like a moron).  It bothered me all of Sunday and when it came time to actually make trading decisions Monday, I had brain drain.  It was an easy decision to just not make any decisions.  I studied up, wrote and charted before resolving what was bothering me last night.  Today, it's all gravy.

When things outside of markets are bothering you, you've got to treat it just like a losing stock.  Lose it, squash it, resolve it, whatever.  It doesn't matter if it takes days, weeks or months.

Being 'in a funk' will undoubtedly be a detriment to your performance, because you're not thinking clearly.

Markets exploit innate human weaknesses every minute of every day.  Do you really want to be more vulnerable to it?  Do you really want to make money trading?  Not everybody can say they don't want to make decisions today.  Use it to your advantage.

As the kids say - Keep it 100

July 18, 2015

RR: Big & Sexy

Immediately Monday, the Greece contagion scenario came off the table.  And immediately the markets were off to the races.  Interestingly sentiment remained negative most all week with the NAAIM index actually falling.  This is a big sign that the negative disposition of market participants (that is a staple of bull markets) is still present.

Check my latest link-fest for some great reads over at See It Market.

Inside the Market

The S&P 500 closed the week back at a major resistance zone.  It seems like the odds are this will eventually break higher, but this area is VERY important.  A breakout and hold above would have such big implication you don't really need to jump the gun with fresh positions here and now.  Particularly with earnings season ramping up.


Looking at the fear gauge, it's gone from fear to nearly fearless in just over a week.  Incredible.


The theme of the week I've tried to preach on twitter is 'Buy 'em big and buy 'em sexy'.  Here's why:


Growth names relative to value are performing exceptionally well and breaking multi-month ranges to new highs.


The largest market cap names are clearly leading the S&P 500 higher.  Friday's action underneath the surface was ugly.


Group Action & Other Markets

Is TLT forming some sort of a bottom?


What's makes that chart really interesting is how dividend names have lagged the market notably during this rip.  That's about as sharp as the moves get.


Financials are broadening out.  It appears the most recent decline was a false break of the trendline dating back to 2009, which suggests this group could get violent on the upside.


Are Citi and Bank of America becoming must own stocks for the rest of the year and even into 2016?


The US dollar broke out of it's multi-month range.


The Tourism Index is testing a key resistance.  Will the fresh dollar strength be enough of a boost?


Of course no analysis of the tourism group would be complete without oil.  Oil is trying to break lower towards measured move targets 5% lower, but bulls have brought some fight at the July lows.


The DAX has broken it's falling channel.  We can expect the 12000 level to be an important resistance level.


Trade 'em well!

Reminder:

All ideas shown on this blog represent the authors opinion based on the data available.