"Everyone has a plan 'till they get punched in the mouth" - Mike Tyson

May 30, 2013

Charts of interest 5/31

The equity put call ratio today came in at .48.  That's the lowest level in 13 months.  The last two occurrences happened in the late stages of last springs rally, but a very low number also occurred earlier in that same rally.  


Here are a couple of setups i'm watching.  

ASTX has broken a relative strength downtrend with price near a possible falling channel break.  The RSI level and MACD histogram divergence appears favorable.  I'm looking to get long a breakout for an attempt at the prior highs.  


 NSANY chose a terrible time to break out of its 2+ year base.  It has come in sharply as the Nikkei has traded wildly, but the stock is treating the prior resistance zone as support.  There was huge volume Thursday as price rejected a breakdown.  You could get long around here versus the gap at 21.

OVTI had much better than expected earnings and guidance.  The stock is trading around 19 in the post market.  The price pattern says we can look for nearly 25.  There will be a day trade here one way or another and another long trade at some point.  


Boston Scientific has a longer term target around 11.20 and is currently trading in a tight bullish pennant.  A break above 9.32 gives an upside target near 9.75.  


DWX is at a support zone and it may tell us the next move in the dividend trade.


May 29, 2013

Trade idea: short TLT put spreads

Now that most of the world knows bond yields are rising, we have a great opportunity to catch the other side of that trade at a key level.  Ideally we will get a bounce or at least a hold of the lows for the next couple of days.  You can see the lower Bollinger band has been an area where downside momentum stalls out and the candle pattern is confirming that.  


Personally i'm trying to scalp it, but perhaps it could be more than a scalp??  Good luck out there.  Remember all bets are off below Tuesday's low.

May 27, 2013

The good, the bad, the ugly and the good!

Here are some big picture charts i'm noting.  

The defense sector looks pretty attractive.  A ~10% market pull in would be fantastic.  We'll be watching this space for quality entries in the coming weeks.      


Semis are another group i'm looking to get long.  It reached the short term target last week and quickly reversed.  A target much higher still remains.


The construction group was turned away at resistance this week.  The same goes for the truckers.  I had been bullish on both and looking to dumpster dive as we wanted to ride the white lightning, but we need to use our heads here and wait for more damage and clarity.


On a shorter time frame we have a momentum rollover leading a classic double top targeting a test of the 50D.  Note the possibility for a larger double top, but that's just a possibility and an upside target of 23.50 remains.


EEM is on near a test of a pivotal support line off of the 2011 lows.  It's DOWN 4-5% in 2013.  Yeah, DOWN.  Why wouldn't it be one of the first to break down hard if it's one of the weakest things out there?  However, 42.20 is the 200 day SMA and a daily tweezers bottom pattern appeared Friday.


We can see NYMO is near an attractive buying zone.  This is also displayed by the NYSE up down volume ratio.


Immersion (IMMR)

Immersion has popped up on the social investing radar in a big way this week after claiming the top spot in the StockTwits 50.  I didn't know much about it, so I figured I'd look into it.

I took some notes from a recent presentation:

This company owns a bunch of touch screen functionality patents and continuously files litigation to reach deals for licensing revs from smart phone makers.  

Their are different levels of the licensing (the more complex the license, the more expensive) and they expect a huge opportunity in their high end markets in the next few years.

Catalyst:  People want the smartphone look and feel everywhere.  This includes microwaves, printers, auto infotainment systems etc.  They also believe there is a large market in industrial applications.

98% of revenues are from licenses and royalties
  • 2/3 of their revenues come from mobile devices
  • 1300 patents in their portfolio (if I remember correctly about half are pending) 
  • this allows 99% margins 
These high margins allow them to pile up cash.  
  • 50% cash growth from Jan 1st to April 1st
  • No debt currently.  
They mentioned Chinese companies (a buzz word?) want to work with them to develop HD touch screen products for other markets (specifically noted other forms of entertainment).

Let's take a look at the charts.  This first chart shows the all time weekly chart.  The stock traded in a wedging pattern for roughly six year and broke out in March.  This gives us a long term target of 26.  


This next chart just shows the different fibonacci levels.  They give us a shorter term target around 17.5-18 and confirm the long term price pattern target near 27.   


To recap: I don't think we can argue that high quality touch screens will be less prominent in a couple of years than they are now.  That's just the way the world is going.  

Also, regardless of what we think of the fundamentals, the charts are showing us there are upside gains to be had in this stock over the coming weeks and months.  

So all in all this has to look pretty compelling to funds and investors in the intermediate term.  Good luck out there.  Keep digging.

Don't forget you can follow me on stocktwits @a_jackson and twitter @a_jackson8

May 23, 2013

A couple of scan results of interest.

Vol expansion watch:  MPEL, RES, MDRX, GNC, ROST, SD, CRR, SKX

Testing the 50D MA:  AMZN, NEE, WMT, DIN, DTE, RS, BHP, VNQI, QCOM, FIRE, EBAY, DWX, EME, XME, CPHD, MCHP, FCX, IDV, UCO, DBV

ROST may be a long vol play into earnings tomorrow night.

Note that high yield names are prominent on the 50 day moving average test list.  

May 22, 2013

Looking at Brent Oil

Let's make this short and sweet.  Brent Oil looks very weak.  It hasn't been able to recover the late 2012 lows and is still trapped under it's long term moving averages.  We can see the double top measures to at least 91.  

Relative to West Texas Crude, it has continued to weaken after breaking down out of a ~1.5 year wedge.  


In both relative and absolute terms this looks like a short with plenty of room to the downside.  If you forced me to pick one, I'd pick the outright bearish position because Crude isn't looking so hot either.  BTW, if you aren't involved in futures markets BNO is the go to proxy.


You can follow me on stocktwits @a_jackson or twitter @a_jackson8


Is this stock market party out of blow?

All sorts of my sell signals went off last week(as referred to here mid-post).  As the market continued to ignore them, I essentially said the hell with it and decided I would focus posts on riding the white lightning until the blow was gone and we all had coke hangovers.  

Today we may have gotten the signal that the coke is gone.  It's signified by major price reversals in the indices.  


Looking at the S&P 100 and 500 breadth data we can see these are completely pegged to the upside.  Something has to give here, right?


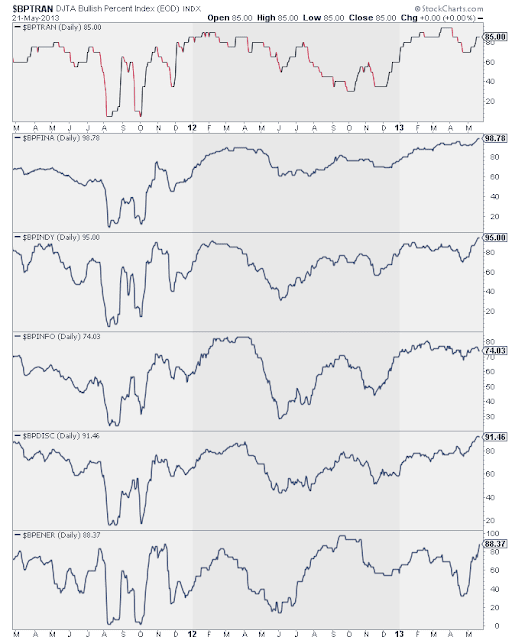
Here are the bull % indices of offensive sectors.  indy = industrials; info = tech ; disc = consumer discretionary; fina = financials; ener = energy.  We can see again these are either pegged to the upside OR are diverging from price (shown in transports and tech) as their groups make new highs.  Neither are bullish signs, but keep in mind people have been making arguments about these bull percent indices since March.


Finally, a contrary point of view shown by the up down volume ratio.  When the ratio was at this level or lower during this rally; a varying bounces have followed.  I don't really know one way or another, but thought it's worth pointing out.  


To summarize, we need to take today's market action seriously as it's the most significant price warning signal thus far in 2013.  I'll be watching our bullish ideas to see if they can hold up, but we just don't know what's coming next.  

Twitter @a_jackson8    Stocktwits @a_jackson

Will Dycom's blow out quarter lead to gains in the heavy construction group?

Dycom Industries reported a blow out quarter.  Maybe this can attract some investors to the heavy construction group.  If it does, one name i'm looking at from a longer term perspective is McDermott (MDR).  Here are some details via finviz.


You can see there was a heavy volume breakdown earlier this month that has somewhat paused this week.  If there are signs of reversal, it will be a great long term entry point, where longs of all time frames can prosper.  That said there are no guarantees this will work and it's currently one of the weakest stocks in the market.  I just thought this is worth pointing out.  

Here is the group chart.  We can see this index is likely to break resistance on this large move by DY today. It will also give a bullish MACD cross which would signal the start of a larger trend higher.  We can't count our chickens before they hatch though, note price and RSI resistance trend-lines just above current levels. 


Better looking names in the group include MTRX (mentioned here a few times this year and technically it's my favorite in the group) and LAYN as it quickly rejected lower prices and has reversed higher this week.  

You can view a few charts from the group here

Blog only idea

Digging into smart grid names I found this ELON today.  It has just announced a  Partnership with Mitsubishi where Mitsubishi will add an ELON smart meter product to it's portfolio.  The news created an above average volume breakout that looks primed for more upside.  The short ratio is currently 7.  The stop is up to you as there is no great place to put it now.  I'll be watching this the next few days and if I take a trade I'll tweet it.  

You can follow me on stocktwits @a_jackson and twitter @a_jackson8 for said updates. 


May 21, 2013

Adding SWKS to the watch list.

SWKS is often thought of as a smartphone play.  Their main source of revenue is from mobile devices, but  40% of their revenues come from other segments with high growth potential like smart energy, autos and home security.  The stock seems to have fallen off many investors map as the stock has done nothing for investors for the last 30 months or so. 

The stock burnt investors who bought at the 2011 lows, ripped and then had a false break above 29 last fall.  While the majority of stocks have ripped hard since the Obama lows, this has merely consolidated in a range.  


That above average volume breakdown and reversal around earnings in April caught my eye.  After that strong run it's traded in a tight range giving back no gains.

A break out of the flag could offer an attractive long term entry point as we bet on a test of the upper boundary line.  You can see we want to shoot for a break of the wedge.

We have to note the 40 week moving average is still pointed lower for the time being and relative strength is showing no sign of improvement.  This isn't the greatest chart out there, but the fundamental story does make this a much more attractive to investors.  


I took some notes from their JPMorgan Tech Conference presentation.

-Their products are all about the connectivity of devices and networks
-Their mission is to capitalize on the explosive growth in connectivity.
-Global demand for connectivity is in it's early innings.
-50 Billion connected devices by 2020 (didn't mention current #)
-Their chips are highly complex
-Their products are very broad based so they offer a more competitive price point to customers (a bundle of sorts??).
-They are positioned for the connected living room and factory floor, smart meters and upgraded wireless infrastructures etc
-Every major smartphone brand has Skyworks components.

You can tell from a lack of news flow and tweets that the mass majority isn't really thinking about this trend.  Check out this Google Trends chart on the term Smart Grid.  It appears it's wandered off the minds of folks after they found out what it was.


To summarize, we are getting closer to a more connected everything and these guys seem well positioned for the early stages of this cycle.  I really think this is a name worth watching for an eventual investment.  I'll have more connectivity plays coming up later this week.

Don't forget to follow me on stocktwits @a_jackson or twitter @a_jackson8.


May 20, 2013

R&D Trade Review: CSCO

I've had CSCO sitting in my chart book for months now.  It broke a multi year resistance line and popped a little bit.  However, for most of this great 2013 rally, the stock had sat in a range.  

The day before earnings I bought the June 21 straddle for 1.45.  My thinking in this trade was simple; the stock was in the middle of a strong push higher and it was just waiting for a catalyst.  I figured even I was wrong and the reaction was unfavorable, the stock had been trading like a caged beast.  Note that tight 5 month range.


I chose the 21 price point because my bias was bullish therefore the calls would be more in the money.  I picked June instead of May so I could ride the position for a few weeks if I chose so.  

I was thinking buying a day early may give me a bit better(lower) implied volatility.  It didn't work out.  Into the earnings report this I likely could have bought the straddle for 1.35 or even 1.30.  

The stock moved higher, as I had anticipated, so then I had to decide what level I was looking to exit at.  The closest thing I had to a reasonable target was the fibonacci cluster at the 24.25 zone.  


I ended up taking the trade off the table as price respected this fib cluster for two days in a row.  I closed the position at 3.05 on Friday.    

To recap, with the simple understanding of the larger picture of price, I was able to favorably position myself for a winning trade.  However, with better preparation and execution I probably could have squeezed an extra quarter out of this trade.   

I think the key take away here is get the most important part right.  We aren't going to be perfect!

China bottoming, BIDU and the new BIDU

Shanghai appears to be forming a long term bullish head and shoulders pattern.  Roughly a 30% move.  The key weekly moving averages have flattened and are in prime position to turn higher.  Let's take a look at some of the ways to play it.


I'm intrigued by BIDU.  What had been the ultimate China stock.  It has consolidated for a couple of years now since the highs around 165.  At first blush who wants to buy a stock that fell from 165 to 80?  Any reasonable person would have some doubts about it.  The key is long term perspective.  In 2008 BIDU traded at a split adjusted price of 10.

Note the angle of the ascent from 08'-11' versus the angle of descent in the decline since the highs.  The rise is clearly the sharper angle.  Whenever that's the case in a stock; it's bullish.


I'd argue that 80 level is a multi-year bottom.  Over the orange resistance line we could see at least a test of the 2011 highs


SINA is very similar to BIDU in that it has a very bullish trajectory and price appears ready to start a new up trend.


Here is the daily chart of SINA.  It has just reacted very well to the gap up.  It's hard to argue that that gap would close any time soon.


VIPS is an online clothes retailer.  It is this year's BIDU.  It has just been on fire while most other China stocks have been consolidating.  Earnings have been strong of late and are beating expectations.


This is a great example of how RSI divergences sometimes mean nothing.  If you had followed that method for determining your exit, then you were out around 12.  Uhh YO!


DANG has nearly doubled off the lows around 3.75 in just a few weeks.  Incredible stuff.  Is it over?  I don't think so.  Let's again add some longer term perspective.  It appears there is some room to test the 10 level and possibly even the fib clusters around 15.50 and 19.


I have to point out that in late 2010, when the company first IPO'd, they did an interview on CNBC from their headquarters and it appeared they were a scam working out of some over-sized 2 car garage in Beijing.  

The important thing to remember is, that even though this may be some B.S. company, it could rally up to 10, 15 or 19 and still be in a strong long term downtrend.

Lastly I'd like to point out this chart/discussion is just to help make a point; I personally would just never buy this.

So you can see there are plenty of ways to play this potential raging bull in China.  The main players are shaping up and seem to be confirming the bullish possibilities shown in the Shanghai chart.

My favorite idea is VIPS.  That is just some fantastic strength in that stock.  However, it is hard to find things not to like about BIDU and SINA longer term.

May 11, 2013

A plethora of MACRO charts

I just wanted to share some MACRO charts that have my attention during the next week or two. Let's start with the stock/bond ratio.  

Stock/Bond Ratio

The possible head and shoulders top pattern was negated last week.  Thats pretty damn bullish for the ratio.  There is a trend-line that connects the two previous tops (not shown) that adds significance to the ~1.45 resistance zone.  

We also must note the RSI divergence.  RSI is not really jiving with what price is telling us.  However, we must also note RSI has lacked significance across the board in this rally.  


As we can see at this major trend-line confluence a bottom formed at the ratio ripped higher.  This


With more concerns being voiced about an overextended market I figured I'd share a few charts that tell me when I'll be more concerned about a top.  A short term peak does appear within reach based on some of these charts.  

Indicators

The NYSE bull % ratio is approaching what has been major resistance so far in this rally.  It make sense if we turn lower after touching this line.


The 10 day MA of TRIN is not showing any signs of a significant top yet.

However, the 10 day EMA is getting very close to resistance.   


The CPCE is also showing we are near a potential short term top.  This could offer a gauge of how significant the top will be.


We are still seeing normal action in Volatility as we approach a bearish boundary.  We can see each time this indicator has reached the upper boundary in this rally, it has followed up with a test of the lower boundary area.


So again we may be nearing a short term top.  However, the one indicator that hasn't fibbed to us once in this entire market rally, is still not telling us to be concerned about a larger top.


International

Shanghai has long lagged the market, but the rising tide lifts all boats theme may be in play here as this could be putting in a major long term bottom.


Spain is sitting just under major resistance.  This line is a head and shoulders bottom neckline.  Whatever the direction the IBEX is worth noting this week.


Dividends & Safe Havens

The Dow Jones Electricity index had traded inside this rising channel basically since the 09' lows.  In April we popped over it.  Now we are falling back into the channel with a potential monthly engulfing candle.  Often that's a sign of trend exhaustion.  We'll know more mid-summer, but I wouldn't be long the space with your money.


While electric utilites may have seen upside capitulation, Staples haven't are still trading at the highs.  The recent higher volume is something to be aware of.


This ratio displaying pharma relative strength broke out a month ago, but off the last market bounce Pharma stocks have really lagged.  A test of the lower boundary line would make sense at this point.


Commodities

Possible bullish head and shoulders forming just over the long term moving averages.  Also note the increase in volume the last few week.  This is just something to keep in mind when thinking about some retail positions.


Tin has formed a long term higher low.  Is this another bullish head and shoulders?  Given the talk about the commodities being doomed this is kind of impressive.


Reminder:

All ideas shown on this blog represent the authors opinion based on the data available.