Market Musings
What price patterns 'look like' tend to drive your emotions, but what really matters is the levels. This issue has been especially relevant in the recent market volatility. There are more market participants paying attention and trading off of these 'looks'.
There are now more bulls than bears according to the latest AAII individual investor sentiment poles. This aligns with the sharp roll-over in the market. Bulls are trapped and hopeful.
Last week, Gatis Roze noted prior bear markets and their eventual bottom. One thing that stood out was divergences between price and volatility via VIX and ATR. Watch those indicators when we do hit fresh lows.
The 200 day moving average in the S&P 500 is now pointing lower. Call it 'official downtrend territory'.
Dana Lyons noted that we've seen 3 90% volume down days in the last two weeks. That immense selling pressure tends to suggest relief in the short term. However, we could have said the same thing after the second 90% down day. It's an incredible stat, but i'm not sure how much value we can derive from it.
Cash relative to the S&P 500 has broken a multi year downtrend. What's a bigger sign of a bear market than this?
The Smoothed Arms index has broken to highs not seen since the last bear market in 2011. It's more confirmation conditions have changed.
Breadth Oscillator smoothed NYMO has reached the 0 bound. If a fresh wave of selling occurs next week, it could be VERY strong.
What's leading? What's lagging? Let's take a look at Ryan Detrick's excellent Market Scorecard
What stood out Friday? Weakness in the housing group and relative strength in the airlines.
Around the Globe:
Emerging Markets are just lagging everything and there still appears to be more relative weakness ahead in the intermediate term.
The S&P 500 is one of the best houses in the global markets neighborhood.
Miners are trying to hold up. There may be a short term trade in the space, but the falling 50 day moving average is catching up fast.
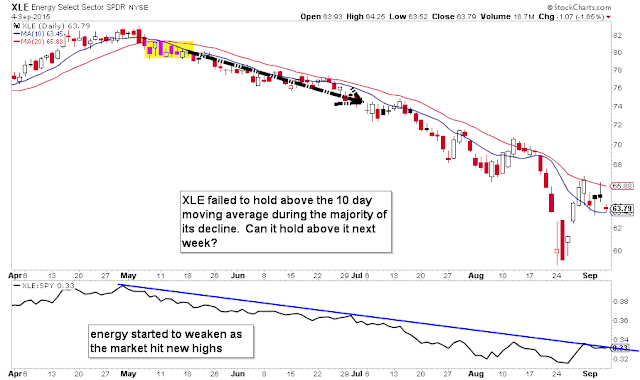
The same can be said for energy stocks.
Biotech, like many groups is wedging for a large move.
Consumer Discretionary continues to outperform the market
Gold has two very different looks on two very different time frames. First, the daily chart seems pretty mediocre.
Second, the weekly is holding an interesting level.
Trade 'em well!


No comments:
Post a Comment