"Everyone has a plan 'till they get punched in the mouth" - Mike Tyson

November 29, 2014

Rotation Report: shale bust

The OPEC decision was huge, and there are a lot of FAST moving parts in the markets off of this news.  Looking at the upcoming week, there are a lot more things that can go wrong than can go right at the moment.  

Black Friday sales could disappoint, as so many retailers have stretched out their promotional periods.  There could be unforeseen reverberations from the oil drop.  Also we have both ISM reports(any energy related slowdown?) and the jobs report is Friday.  With that, let's dig in!


The stock only NYSE advance-decline line hit it's flat upper bollinger band.  The market is running pretty hot short term.  


The ratio of high yield to investment grade corporate bonds continues to act poorly.  Is there some bad news coming from the highly levered energy space?


The home builders ETF has reached MAJOR price and relative strength resistance


The stock bond ratio continues to apparently top at the 2007 high.  This is interesting.  Is a theme emerging for 2015?


If you want a better read on the retail action post Black Friday, check out my See It Market post on Amazon  The stock is at a critical level, and the near term direction may give us a hint about the group.

The 30 year treasury yield has started a new push lower.  It'll be interesting to see how it acts in that October panic area.


The S&P dividend index relative to the S&P 500 continues to test an 80 week downtrend.  Is the yield chase coming back?


Nobody is talking about it because of oil, but doctor copper has pneumonia as it broke down to fresh 2014 lows. 


Now to the big story of the week, energy...  

The rail index wiped out the last two weeks of gains this week.  No doubt rails have been a huge beneficiary of the shale boom.


The oil producers ETF pooped the bed after testing the falling 50 day MA.  Newer trader's might want to study this textbook action.  The fresh MACD downside cross suggests there is ample room for downside.  Here's a breakdown of drilling costs of various shale projects across the world.  


Is the Bakken boom over?  It makes for a great headline, but the world isn't binary.  What we do know is Continental Resources relative to the oil producers group has cleanly broken the uptrend from the 2009 low.  That's ugly!


With this huge energy sell-off, Halliburton is now testing trend support connecting the 2009 and 2011 lows.


It's easy to want to buy energy stocks here, but I look at something like an Apache (APA) and it couldn't even rally while XOP ripped for years with oil much higher.  This likely has much more downside coming.


Airlines appeared to be rolling over, but were bought back up immediately as earnings estimates crank up with lower oil and fuel prices.  


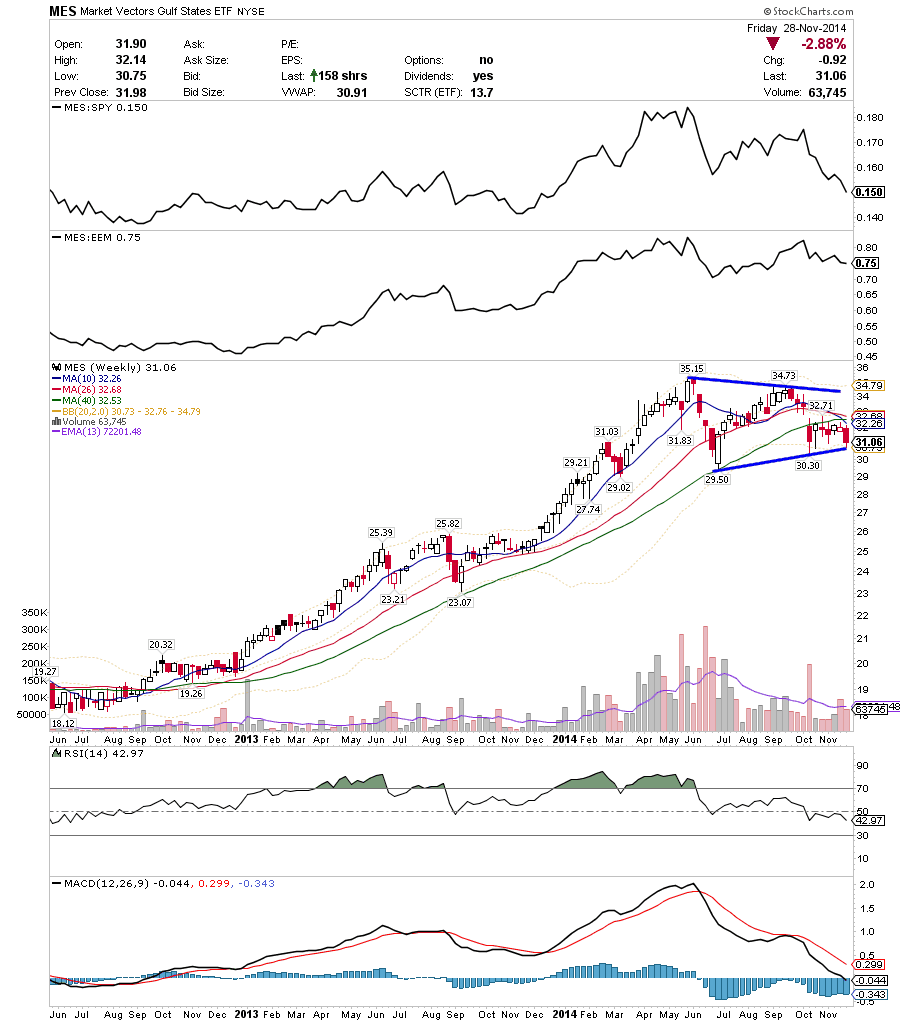
OPEC is apparently more concerned about making a statement to than they are their own good.  The gulf states ETF, comprised largely of middle eastern oil producing countries, is sitting precariously at key support.


Moving outside of the US...

Germany had a very strong week after breaking resistance from the summer highs. 


Emerging markets acted quite poorly after early week strength.  How do they act with all these MA's nearby?


The all world index is finally testing the September highs.


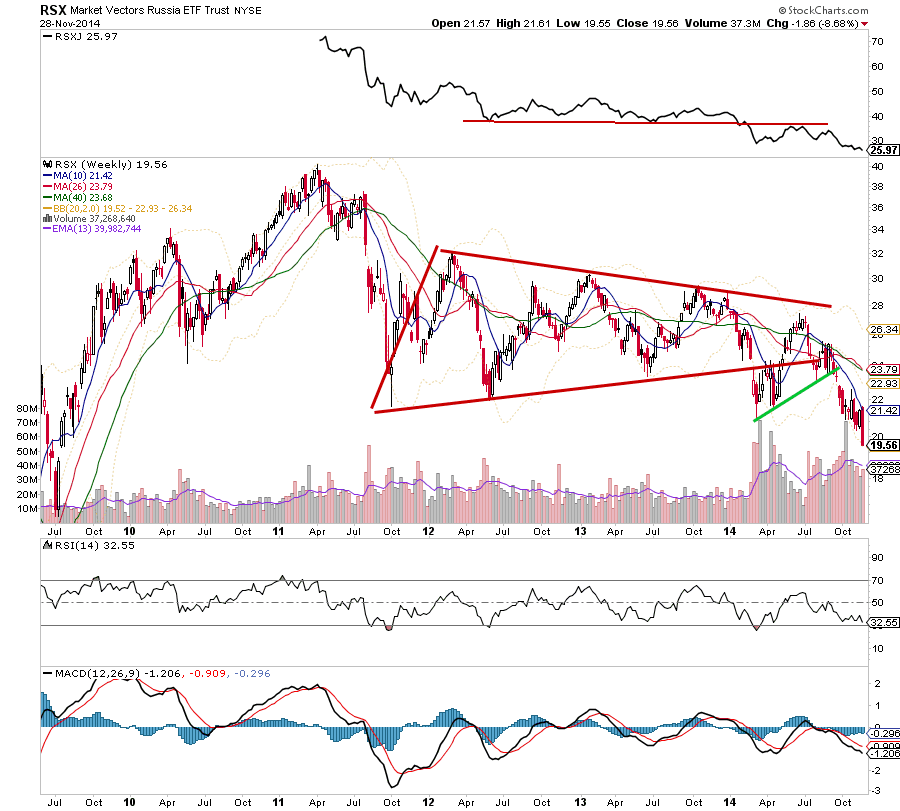
Apparently Russia sent some warships into the English Channel.  Who knows what to make of it, but their market is really struggling and the defense industry continues to trade well.


Trade 'em well!

November 23, 2014

Rotation Report: Blow off top

This weekend traders everywhere are wondering if the Friday gap up was the blow-off top in equities.  Let's take a look.

Friday SPY touched the flat/falling upper bollinger band.  It's hard to see much more upside coming this week with this band setup.  But hey, anything is possible.


Looking in depth at the NYSE, we see the advance-decline line, the up-down volume line and stock only advance decline line all hit new short term highs.  Strong action here


The stock / bond ratio via SPX/USB ratio is testing the 2007 highs once again.  It's such a HUGE level.


The 10 year treasury yield looks ready to roll over here with 3 topping tails at the falling 10 week MA.


Volatility term structure continues to trade in the toppy zone.  We've seen that can persist, but it's more extreme now.


Is sentiment getting overheated?  It's pretty close


The smoothed traders index is also at a clear overheated area.  The last two dips down here were the peaks in last December and September.


Shifting outisde of the US...

Brazil had a heck of a week and is testing some resistance after blasting through the 50 day MA Friday.


Emerging markets relative to the emerged markets continues to consolidate.  It appears there is more opportunity in emerging markets heading into 2015.


Asia via APB has found buyers at the 40 week MA time and again.   


Copper is still trying to base and bottom out.  The Friday action is uninspiring.  It's worth keeping an eye on the falling 50 day MA as it's right here at price.


Back to some US stock groups...

The energy producers ETF is at a key level.


Airlines are starting to roll over in a meaningful way.  It's safe to say they were a leading group off the October lows.


This coming while the Transports advance-decline % line shows a slight bearish divergence.  This sure doesn't seem like a good time to jump into a transport stock. 


Gold Miners are resting at the first key pivot level.  Early week action may set the tone here.


It's going to be an interesting holiday week.  The market's posture seems fine, but we're definitely reaching some extremes where we want to back off the long side.  It also appears treasuries will be a place to be long this week.

Trade 'em well and have a great Thanksgiving!

November 20, 2014

Brand new bullish signal in Retail stocks

Today we've got a brand new sign of strength in retail stocks.  Retail's relative strength broke free of over a half a year of resistance.  We can call it a major head and shoulders bottom.  This is a group we all need some/more long exposure to.


Traditional holiday plays are working, cold weather plays / home renovation plays are working.  It's a great group right now!  Feel free to shoot me a tweet if you know of a public company that does roofing in Western New York :)


Trade 'em well!

Biotech

If you haven't by now, check out my biotech post on see it market.  In short, a big move is coming soon, we just aren't sure which direction yet.

These last couple of days have seen XBI print some toppy tails.  As you can see, the action is happening at channel upper boundary resistance.


Taking a closer look at the daily chart, we see the wedge building with a positive RSI reversal.  More deets about the positive RSI reversal on the chart.


The 173-166 range is our short term tell.  That said, the R/R short is favorable given a decent open(risk 4 points to make 16 points).

Trade 'em well

November 15, 2014

Rotation Report: Huh?

There are plenty of mixed signals in the broad indices these days.  Just guessing and reading some of these indicators we'd guess the market would've dipped by now.  But, this last month's rally caught many professionals off guard and the lagging fund managers are taking every opportunity to add alpha and bid up various stocks.

As @awealthofcs tweeted the other day:    


This won't change into the end of the year.  There will certainly be opportunity in various stocks even within an upcoming pullback/correction whatever.  What's important from a trader or individual investor's standpoint is to not to anticipate a pullback in our stocks or anticipate your stop being hit.  Each stock is different and our best winners likely won't even trigger the stop.

With that, let's dig in!

Microcaps tried to break the year long resistance line and failed this week.  Is this the bears last hope?


Vol structure is still in the toppy zone.  It hasn't mattered much last week but it does matter.  


S&P 500 breadth is still in a corrective phase.  The market is thinning out and that is a problem in the short run.  As you can see, it didn't prevent a grind higher in 2012.


One huge potential piece of evidence for stock bulls is the S&P div index relative to the S&P 500.  Is that a false break over long time resistance?  Dividend names look to be out of favor here.  Managers want beta.


The highly publicized breakdown in consumer discretionary relative strength has reversed!


The consumer ratio has now developed a long term support trend line.  This has become a clear positive for equities although we'd like to see more evidence like a higher high to confirm it.


The transports have led but are back at upper boundary resistance.  What's different this time?


The corporate bond ratio is still pointing lower and may have peaked nerm term.  Will the August lows hold?


The dollar traded pretty awfully Friday.  This is trading like a top in the making, but we don't have the evidence to call it that yet.


It's also pretty extended on the weekly chart as it approaches long time resistance.


Oil volatility has wedged for a month.  The oil market is the market to watch this week.


If you want to buy an energy producer, why not EOG?  The long time out-performance is staggering.


Nat Gas may have bottomed Friday after dropping as much as 15% during the week.


Is Copper trying to find a bottom here?  It sure looks like it.


Brazil dropped back down near the key post election low and was bought once again.  The risk -reward long is favorable, but are the probabilities?  I think so.  Any possible bottom in the mining group would be an added tailwind short term.


Is that a head and shoulders bottom in EEM?  That could be a huge boost to the global markets.  


Trade 'em well!

Reminder:

All ideas shown on this blog represent the authors opinion based on the data available.