"Everyone has a plan 'till they get punched in the mouth" - Mike Tyson

January 26, 2014

Portfolio Update

Here's the updated portfolio.  Full details below.  Cheers!


Given the developments during the week it was becoming clear to tighten up loose ends.  Loose ends = positions not working as expected.

Stopped out of JOY long - ya know I could have waited for a clear break of the prior low at 52.40, but momentum is weak and this has really just done a whole bunch of nothing since I first bought it last summer.


Stopped out of HBIO long -  During that whole biotech run this month the stock actually traded town.  It re-tested the LT resistance line at 4.75 and broke below the mini base it formed.  The chart still has bullish characteristics and is a candidate for re-entry.  Maybe you can get a good entry now?


Stopped out of SWC long 12.75 - the volume this week was monstrous in a massive weekly engulfing reversal.  If it bounces soon there's a H&S top setup waiting.  We'll definitely keep an eye on it in the future.


Sold partial VIMC 3.45- when the china issue really came to the forefront Thursday AM I decided to take some profits selling approx 60% of the position.  By Friday's close I wish I had sold the whole thing!  Haha, just joking.  The volume pattern is very bullish and I still want to let it run.


Sold GOGO 23.50 - This just acted iffy on the falling wedge breakout.  After the minor rising channel broke down I decided to exit.  


This week in technicals(TWIT): Stocks at a critical juncture; Asia takes center stage

One word explains last weeks action:  Nasty.  What makes it even more nasty is there were a ton of fresh warning flags on Friday.  Now a plethora of key trend-lines are being tested.  Let's dig in.

First a couple of notes from last week's review:

  • Specialty retail is still setting up a bounce
  • XHB has completely broke down and it can easily lead to a larger breakdown
  • The SPY cycles chart absolutely nailed this key turning point.  That makes me wonder what the heck is in store this summer..

Summary:
  • US stocks are at a critical juncture
  • An oversold bounce is likely this week.  It's hard to bet on anything sustainable
  • Bonds and Gold continue to show strength as more signs of a flight to safety is underway.
  • We need to watch Asian ETF's in the near term for hints.  

Stocks are at key junctures

The S&P 500 high beta ETF approaching it's 7th touch of this support line since the Obama re-election lows.  A break suggests a near term shift towards defense.


IWM is a mirror image.  If it breaks there isn't support until the high 90's.


Financials are at key price and relative strength support.  Bounce trades could be in play early this week.


Energy has broke a 19 month 5+ touch support line.  Maybe it bounces back above horizontal support, but i'm sure as shit not betting on that with my money.  


Broadcasting is now touching this 8 month support line for the 4th time.  What an uptrend.


Chemicals are approaching this support line from the 2011 lows for the 6th time.


Yellow flags are waving like a NASCAR race at Bristol

The VIX, on a weekly closing basis, has broken the downtrend from late 2011.


The HYG/TLT ratio is approaching 1.5 yr rising T/L support after breaking a gradual 5 month support line.  With the first test in 8 months it seems logical this will bounce.


Other bond ratios are really suggesting caution.

The S&P 500 to 30 yr Treasury Bonds ratio is telling strategists to push allocations from stocks to bonds in the short term.


Nasty breakdowns are in progress in EDD/US Bonds.  A flight to safety in credit markets is underway.


The ten year yield gave up the long term trendline breakout and is looking more and more like a false move.


Gold barely snuck out of channel resistance to end last week.  Can it test the falling 200D??  The MACD is already diverging.  Sign of a corrective bounce??


Is a short term bounce due soon?

Smoothed TRIN broke an incredibly clear 10 month downtrend last week.  That rarely happens on charts like these.  Just looking at the prior peaks you could say aggressively buy 'em, but very short term bounce trades make more sense.  If this is going to have an out-sized move higher, it'll happen in the next few weeks.


Eyes on Asia

The Singapore iShares broke down from an 8 month wedge


Japan is at a support line started this fall.  This thing has really compressed since May.  I'll just thrown in none of the Japanese ADR's look good at all.


Here are some key happenings in the Chinese charts:  

The Hong Kong ETF is at it's 5th touch of support from the 2009 low.  This thing is nasty scary if it doesn't hold.


Financials have pierced support connecting the 2011 and summer 2013 lows.


Real Estate is at critical support connecting the 2009 and 2011 lows.


The small caps are in a similar pattern to EWJ.


From a longer term perspective this is a wait + see market.  Yeah we can look to some bounce trades off support, but then what??  After months of being on cruise control, we have to freakin' bring it this week.  Trade 'em well!

January 21, 2014

Fresh Ideas

Here's two fresh ideas i'm watching this week.

 BZH continues to trade much better than the housing ETF's.  The first chart shows an up-slanting 3+ week cup with handle pattern.  Check out the second chart showing the four year resistance line break and a quick re-test of the 10 week MA.  You could put a stop under 21 and let her rip for upside up to the 2009-2010 highs around 35.

You have to keep an eye on it though.  It's possible this is just a large rising wedge starting in 2012 that is capped by the line that connects the Cup.  I'm absolutely leaning long term bullish, but we have to keep an open mind.


I looked into RVLT after the positive CREE EPS.  Currently the stock is trading in a 3 point wedge within a potential 3+ year head and shoulders bottom pattern.  The simple protective stop is under the rising support line around 2.90.  Also, going with a full position size here and now is risky because price failed to reach the wedge upper boundary in late December.  If this thing plays out to it's potential, we're talking about a double digit stock.


Finally, I highly recommend looking into this post on UPL from Peter Brandt.  Nat gas stocks are perky and this thing is very rip-able over 22.

I'd also like to point out that I made no position adjustments today.  Outside of FEYE, everything held key support or advanced.  Trade 'em well!

January 20, 2014

Opening my book

When I started this blog I had no idea what I wanted to do with it.  I still don't, but what I've come to realize is that you, the reader, just deserve to know what I own IE what ideas I think are the best.

For quite a while I was stuck in between; who really gives a damn what i'm trading and damn some of these ideas are so good you can't put them out there for free.  That's a hell of a conflicting range of thoughts isn't it?

Today I'm busting out of that box.  Hopefully this adds more depth to my tweets/posts and maybe I'll be able to learn more about myself in the process!

Here's a look at my current holdings showing entry price, size, and current gain/loss with some notes below. When necessary, I'll update the new 'holdings' tab. Cheers!


I kind of forced the add here in CLDX.  It may come back to bite me.


This has worked like a charm.  It's a longer term hold with a stop at 20.50.  I'm looking to sell towards '07 highs in the 40-50 range.


I've been sitting on this thing awhile.  A clear violation of the rising black support line is the Q to exit.  Otherwise I like it to the 2013 high at least. 
.


This is a spec bet.  It hasn't worked so far, i'm giving it down to the 40 wk.  Upside potential is fantastic until proven otherwise.


I took half off into the bull flag measured move Friday.  I have a runner.  Let's see if it wants to trade sideways.  Stop on the rest is 62.  


Thought this was worth a swing long.  Reward/risk is excellent.  Momentum is not confirming new lows and the monster gap up giving us a positive longer term framework


I like this NMRX long term.  It's a M2M pure play with an accelerating growth rate.  This thing could skyrocket over ATHs around 18.  My stop is still at 12, but should probably move it up. 


The stop in this SWC is .30 under the 10 wk SMA.  Obviously i'm anticipating a break of the blue resistance line.  It's pretty close to a pure palladium/platinum play.


I love how sneaky legit this VIMC is.  Targets at 3,4,5 and more.  The textbook technicals have me sitting tight for quite awhile. The stop is at break-even around 2.25


Weekly Market Preview

Last week was pretty wild with a certain groups getting hit hard and other groups ripping.  Overall it was a tough week, but there was plenty of opportunity for successful long swings.

This is the start of earnings madness. There are about 70 reports I'll be looking into on this shortened week.
If you're inexperienced, it can be brutal trying to swing trade because of all the moving pieces.  The odds are very good that a swing trader gets caught up in a false swing that flips the other way 2-5 days after the earnings move.

With that, let's dig in

Quick summary:

  • Signs of caution continue to build into earnings.  An intra-earnings season sell-off isn't unusual and I expect one this quarter.
  • Groups like software, drugs and construction continue to lead.
  • Setups are more scarce, but there are plenty of short term bounce plays 
  • Group bifurcation is increasing.  The consumer might just be dead with the way the group is trading!

Reviewing last week's preview: 

After a pullback early in the week TLT reached new highs and still looks fantastic as it approaching the October high and declining 200D SMA.


GDX had a fantastic broke the relative strength H&S bottom and poked over the key resistance line.  The group still looks good over the short term.


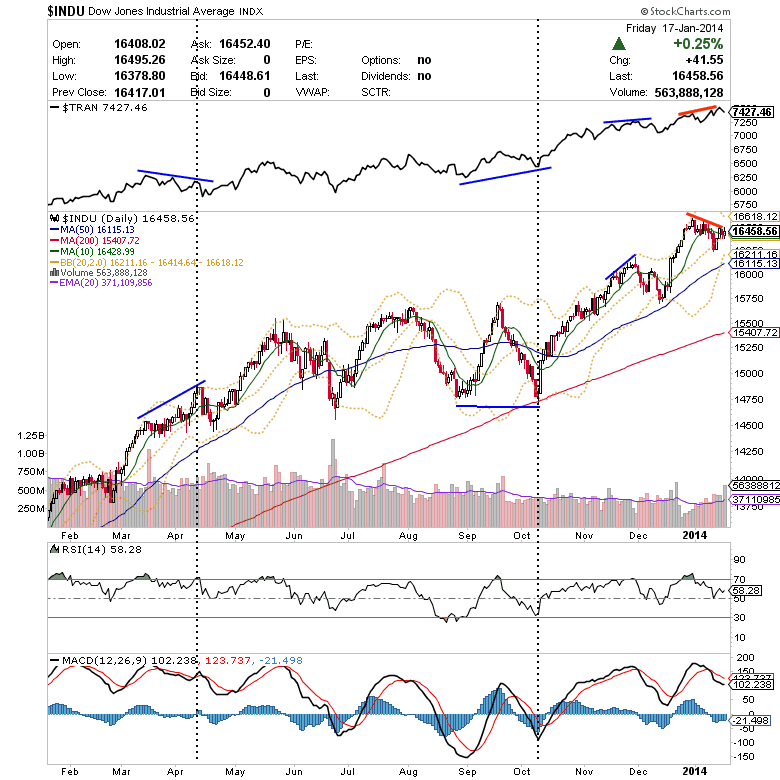
The Dow Transports high still hasn't been confirmed by the Industrials.  This becomes a bigger issue as time passes, but it's tough to be that concerned yet.


I entered VIMC, mentioned last week, on Thursday and added Friday AM.  This thing has rocked and has serious potential still.  Unfortunately there isn't an attractive setup for fresh longs here and now.


SLCA broke down from it's pattern and, with a lethargic move back to the breakdown area, it's a short candidate at this point.


Broad Market

A bunch of SPY peak and low cycles are lining up around this week.  Any outsized moves may give us a hint to the future direction of the market.  


Volatility is getting real low.  So low it's a bad thing IMO.  Note the trendlines are converging.


% of S&P 500 stocks over the 200D are approaching critical support lines.  A loss of the more gradual line B is a signal to reduce longs in a meaningful way.


Base metals continue to coil under resistance.  Big gains could be ahead in the group

Gold + miners story could really accelerate if the orange + blue resistance confluence are both taken out.  


EEM was rejected by the 200D.  The 39.25- 40.50 range is critical.


The Nikkei dojied off the 10 wk MA and the weekly MACD is still positive and approaching a test from above.


The Aussie Dollar is breaking down invalidating the large double bottom pattern.  Momentum isn't confirming, but this is worth watching in the commodities space.


Stock/Group trade ideas

Specialty Retail has had a sharp break down. Looking for a bounce around the 40 week moving ave. 1% lower.


Let's watch housing (ITB) into the 10 wk SMA.  Recent IPO LGIH has been largely unaffected during this recent pause and ripped hard last week.

XHB price is at a 3 month support line.  Will it hold?  If it breaks, I want to have short exposure to LOW via Feb options.


Restaurants appear to be following retail lower.  Nasty chart of late


Semiconductors have reached heavy price and relative strength resistance from the mid 2000's.  It's smart to stay away from fresh longs in the group for now.


Strong groups that must continue leading:  Shippers, Software, Drugs, Fertilizers, Construction

Large banks sold off hard post earnings.  For example: C.  Watch the strength of the bounce at the 50D.


It's amazing how strong Amazon has held up with the retail weakness.  Clearly people did the online shopping thing this holiday season.  It wouldn't surprise me a bit if it skyrocketed on earnings.  I want long exposure leading into the report.  


I'm watching EXTR as it pulls into it's previous base.  There's a heck of a catalyst here as they have the in-stadium Wi-Fi at the SuperBowl.


Have a great week folks.  We have no choice but to bring it this week!!  Good luck!!!

Reminder:

All ideas shown on this blog represent the authors opinion based on the data available.