"Everyone has a plan 'till they get punched in the mouth" - Mike Tyson

May 30, 2015

Rotation Report: Flipped Switch

The switch has flipped.  Bulls don't know what they're bullish about, but bears know exactly what they're bearish about.  That's the polar opposite versus 3-4 months ago and the preceding 5 years.  Don't fight the fed and don't fight the trend are the new utterances for clueless drone traders and managers.

With each new low in the Dow Transports there are a handful of new commentators explaining why they don't matter.  Think about it.  Remember the countless bullish occurrences in the market over the last 5 years?  Where scores of market commentators lined up to tell you excuses why they didn't matter (ie the Fed's ruined everything).  That doesn't mean they'll be wrong soon though.

@millenial_inv ponders, is it now smart to be stupid?  It might just be the next few months.  We look at the various divergences in breadth, Dow Theory and some recession-esque economic data and they're all warnings signs that can lead the market for quite some time.

The issue with thinking things can continue like this for some time, is the 1.618 fib extension level from the 2007-2009 range (the 2138 S&P 500 level) I continuously mention..  If you're a Fibonaccian - this is pretty close to ''an ultimate test'.  A Golden Ratio extension coming off the most important range of the last generation in the world's most renowned stock index.  You'd think we could at least get a pullback with deteriorating breadth and fundamentals.


If this 2140 area in the S&P 500 is taken out, we're going to add a few more plays to the chaser's playbook.

It's worth repeating that regardless of the broad market, short term traders with a focus on the upside are making the most money.  Barring a massive market event, odds are that can continue in June.

Anyways, back to the charts...

Fear is at the top of the recent range.  This suggests we've seen no shift in environment even though the bulls have lost the baton short term.


Groups

Point blank, it sucks to be missing the semi trade.  The leaders in mobile computing, data center and the internet of everything have done an incredible job separating themselves from the group this year with massive gains off the October lows..

It's so hard to short single stocks.  M&A risk continues at a multi year high.  The financing for deals is there and more importantly growth, like in the semi space, is becoming increasingly scarce.

Now large buyouts have the space at 52 week highs.  Interestingly, SOX relative strength has lagged recent highs.


Biotech has stalled like the rest of the market.  It'll be interesting to see what comes after the big cancer conference which ends Tuesday.


Financials are at the heart of the 'I don't know why i'm bullish, but buy 'em cause the fed' epidemic.  Is this multi year laggard going to buck up and lead?  Or is this a false breakout?  This could be the opportunity of the year to short financials, with limited risk.   


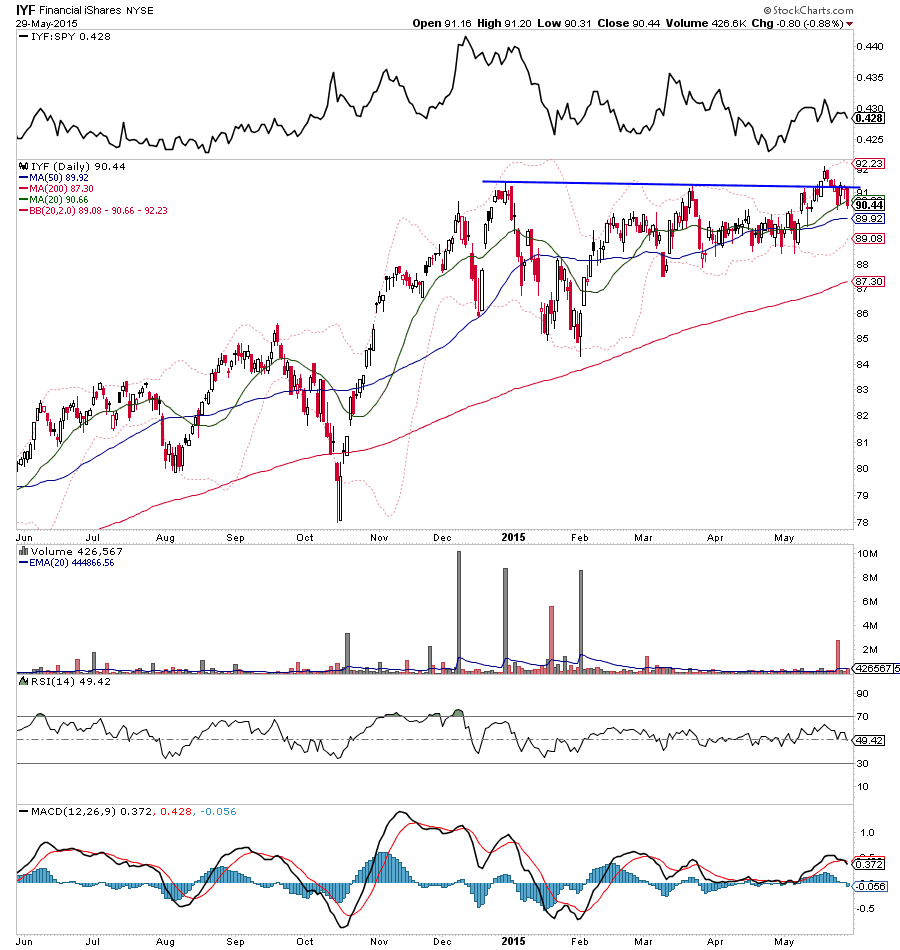
Oh by the way, the TED spread is rising every day and at 2 and a half year highs.


Tourism has pretty much confirmed a false breakout.  The group's US components have acted poorly of late.  Note the recent exhaustion gap in EXPE (not shown).


Selling continues at the 50 day moving average in the retail ETF.  BTW, anybody been to the mall lately?  There are more 20-30% off sales everywhere.


Other Markets

Just when you thought Nat Gas might hold a rally... where will it stop and base?  This could be part of a larger bottoming process.


High yield bonds continue to hold a bid.


Emerging Markets ETF EEM is persisting below the lower Bollinger band as they approach the 100/200 day moving average combo.


Note when Hong Kong joined the latest Shanghai rally it really marked the top in China.


The Philippines continues to be one the world's best markets as it approaches a potential buy zone.


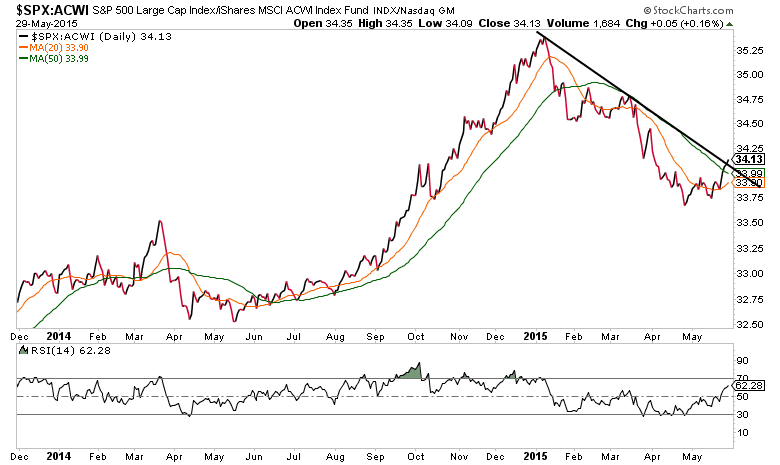
Can the S&P 500 break away from it's 2015 downtrend relative to the rest of the world?  That'll be a key with the damage picking up in China, other emerging markets and Europe.


Trade 'em well!

May 29, 2015

morning charts

Here are a few things i'm watching today.

The ASCO (oncology) conference starts today and runs into Tuesday.  Here's an intraday breakdown of biotech ETF IBB with some key levels noted.


Energy continues to lag the broad market.  Somehow, bulls have had nothing here all month.  The 100 D MA was a main target of mine off the RSI divergence trade into the 200D MA.  The downside might be done near term.


Brent Crude is bouncing off the rising 50D MA.  


CRZO is wedging tightly.  Is a pop coming?  


Is the post IPO downtrend in LC over?  It sure looks like it.


After last week's sharp fake breakdown, CUDA is testing the falling 20 MA.  


3D Printing stocks are hated.  SSYS continues to hold the 10D MA as it curls higher.


May 28, 2015

Purgatory

Market players continue to frantically buy dips.  We've seen this story before though prior to last week's weak rally.  ~2040 in the S&P 500 is still such a key level

Even with yesterday's exciting rally, breadth continues to thin.  And that's fine, there is plenty of stock action yet.  It's very possible for the indices to rally hard if we get over the key fib level.  


With Shanghai's 6% loss, maybe the US relative to the world will break free from the declining trend and 50D MA...or maybe not.


One thing no bear dares mention is smoothed TRIN is actually at 2 month highs.  Bulls apparently have firepower here.


With so much good out there, one chart that continues to stand out bearish is Chipotle as even the 40 week moving average is now turning lower.


I'm out for the day.  Trade 'em well!

May 26, 2015

Corporate Welfare

Global QE has turned the stock and bond markets into a corporate welfare program.  Junk rated borrowers only defaulted about 2% of the time in 2014.
The speculative-grade default rate, which tracks so-called junk-rated issuers, fell to 2% last year, down from 3% a year earlier, according to Moody’s.  That’s the lowest since the 1% recorded in 2007, which was a more than quarter-century low. The historical average default rate among junk-rated companies is 4.5%.
full post via WSJ

Oh by the way, since investors are gobbling up yield like it's cocaine, issuers are finding ways to protect entities and add risk to investors.  This trend is only going to get worse over time.
“Investors are freely and liberally trading a lot of covenant protection for the opportunity to be in the high-yield space” 
 more on the lack of junk bond covenants via bloomberg

How does this play out?  Who knows.  Perhaps it'll take something that will wake up the general public to these disappearing covenants.  Or possibly, the government will intervene.

Maybe companies will continue to find funding for some time with global rates so low.  If that happens, it's a recipe for worsening corporate behavior.   At some point we'll hear some amazing figures about these zombies and wonder how they amassed so much debt.

Regardless, it's something to keep an eye on over time with default rates abnormally low.


wild china action

Check out some of the things volatile action going on in the China names

QUNR sold off Friday before ripping 10% intraday, before selling off 13% Tuesday.  Wow.


CCIH sold off hard Friday, flashed relative strength early Tuesday and closed 15% above the day's low.


The junkiest of china stocks look the best now.  Maybe they'll fail, and JRJC is approaching some monster resistance. 


TAOM Tuesday volume was that of the average weekly volume of the past half year.  


Is TEDU setting up for another rip?  


Opportunity Cost Matters

I hate charts like the one in FEYE right now.  I try to avoid breakout trades like this as they can really hurt you in terms of opportunity cost.  There's a chance this stock may just grind up the upper rail, but you might as well buy a CD.  Of course this could also break to new highs, but it's worth waiting at this point.


A bull can tell you it's a screaming buy with a technical breakout suggesting a move to the low-mid 50s, a bear can say it's a screaming sell.  Biases are confirmed left and right.

Truth is, anything can happen and what would likely frustrate the most people is if it obeys the rising upper boundary line and holds the triangle breakout.

One thing that can't be questioned, is the significance of the rising support line, currently found near 41.  It's also worth noting that volume looks great.  Maybe that's an extra sign the stock can break that upper boundary line and eventually to new highs.  Until it does, there are just easier places to put money in my opinion.

Trade 'em well

May 25, 2015

Rotation Report: Bear Press

Hopefully everybody enjoyed the long weekend!  Damn, the good times always go too fast don't they?

Be sure to check out my favorite reads of the week over at See It Market.

A major fibonacci level stalled out the S&P 500's breakout.  That's a big concern until it's taken out.


It's also been one hell of a stock pickers market as the chaser's playbook is working well.  Here's a quick overview of at what i'm looking at this week.

Biotech is testing key resistance as it's formed a descending channel pattern.  


Treasuries look ready to bounce and seem to be a top theme into this week


Emerging Market Bonds have held up damn well and are currently finding buyers over an important pivot level.


Real Estate is strengthening at the 200 MA.


 Financials have broken to 52 week highs.  Again momentum is weak but maybe it's just temporary as the market works itself out.


Overseas

For the first time in weeks Hong Kong followed Shanghai higher Friday.  That's a big signal in my book.  EWH broke a continuation triangle higher Friday.


Russia looks broken and could be great a short up here.


Other Markets

Various Base metals are testing bounce levels.  Copper is testing the rising 50 day moving average.


The Dollar is really strengthening, but the Euro and Aussie dollar (not shown) set to test key support early in the week.


Trade 'em well!

May 20, 2015

Analyzing the IPO ETF

Some ETFs can provide valuable information about how various market groups are trading.  Digging through the holdings and structures can provide us with plenty of information.  Let's take a look at the IPO ETF for example.  I thought 'hey this would be a great proxy or tell for the recent IPO space'.  Sadly, that's not the case.

Here are top holdings of the IPO ETF.


It's highly weighted in higher market capitalization names like Twitter and Alibaba, which are trading poorly.

Here's a look at IPO's chart


The price action in the ETF is misleading and is not indicative of the trading opportunity or price action in the group.  Things like FRPT, SHAK, AMBA, DATA, JD, MBLY, ADPT are just smothered by the weighting system.

Was IPO was just constructed to be a just another motif for advisers to pitch?  Maybe, I doubt it, but who knows.  The fund's construction methodology is just not conducive for us to measure the true activity of recently IPO'd stocks

Full disclosure: i'm long DATA and SHAK

Trade 'em well!

May 19, 2015

The chasers playbook

Judging by the sentiment polls, there are a lot of traders and investors not long enough.  I've been one of them(more on that in a later post).  What if the skepticism is wrong?  It's certainly looking that way more all the time.  Here's a basic list of what I look for when it's time to hammer down on the long side with some current examples.  Full Disclosure i'm long DATA and SHAK at the time of posting.

Mid-cap growth leaders:  The cloud and data storage continues to be a leading trend with great price action across the group.  Recently DATA broke a one year base on a large earnings gap and appears headed much higher.  So we've got a in a great group.  Last quarter the revenues grew 75%!

The hot china internet stocks:  QUNR failed to break the 20 day MA and has traded in this range after doubling.


Highly Doubted Low Float Growth Story:  Shake Shak is a highly doubted, low float growth story that's just caught fire.  The daily chart is pretty rough looking, but intra-day is showing a monstrous triangle continuation pattern.


Aaand of course there's the highly visible momentum rally.  After a two week consolidation PTBI is breaking out


Trade 'em well!

Fib day

We're set up to test the 161.8 fib extension of the financial crisis range today.  Depending on data, the actual level is somewhere in the next half percent.  I've seen 2130, 2138, 2136.  Whatcha got bulls?


May 16, 2015

Rotation Report: Palindrome syndrome

palindrome - a word, phrase, number, or other sequence of characters which reads the same backward or forward.  via wikipedia

It's only fitting that in the midst of palindrome week, the market maintains a bid off recession-like economic data.   No matter how you read it, apparently it's good news.  Check out @MishGEA's take on the consumer after this week's retail sales.  I'm no fundamentalist, but I respect Mish's work and noting this as he speaks up. Also, @EddyElfenbien notes industrial production fell for the fifth straight month.  

Alas, the market is not the economy!  Let's dig in!

Flows and Internals

Checking in on the NYSE dashboard we see a slight divergence in the A/D lines and volume.  It's a concern that may setup for a false breakout or moderate correction, but really it's not a huge divergence like seen at say the 2007 market top.


SPXEW continues to under-perform SPX.   This is not a good look as we hit new all time highs. 

The most recent example of the market advancing with lagging breadth was last September leading into the 'Fearbola' pullback.  


The stock to bond ratio broke key resistance after a sharp run.  It's worth eyeing for the next couple of weeks for follow through.  Keep in mind this is just one of many measures that are testing key levels.  Also a breakout doesn't mean stocks have to go up, but it's quite the potential tailwind.  Perhaps it could support a rally although breadth is thinning.


High yield stocks are once again trading lock step with long term treasuries.  It's like they aren't viewed as fundamental businesses, they're viewed as tools to achieve desired portfolio yields.


Groups

What's been evident across the market is patient buyers and sellers are both happy in what still appears to be a range-bound market.


I explained why i'm not a big fan of financials here.  Show me something other than JP Morgan hitting new highs.  That plus group breadth is still lacking in a similar fashion to the overall market. 

Agribusiness continues to lead.  I called out some of the better looking Ag names in the group Tuesday.  

The transports via IYT caused a big scare mid-week, mainly because of the rails, which carry an unusually heavy weight in the index.  It's amazing how this thing keeps bouncing at support, but of course it's causing a notable divergence with the dow industrials .  

Consumer Staples surged strongly at the end of the week and may set up a price and relative strength breakout.


Health care and the Semi's via SOX (not shown) broke 2 touch descending trendlines, but still are still working through horizontal resistance.  


Bonds

We're in a yield hungry world filled with underfunded pensions.  Speaking to that point, it appears that's related to the recent out-performance of high yield bonds relative to treasuries, bunds etc.  Perhaps when treasury yields are too low, money flows to the more acceptable yields.  These ratios sure haven't been a risk-on, risk-off indicator over the last year or so.


Bonds from TLT to LQD ended the week breaking sharp short term downtrends after flashing divergences at lows.  120 in LQD could be an interesting area to get short.  Check out @jbeckinvest's post noting evidence of steepening yield curves.


Overseas

Global Markets in 2015 are still not a U.S. based story as the S&P 500 reverses much of last years gains relative to the world.


Emerging Asia has found many buyers at the 10 week MA the last couple of weeks.  Heck the whole emerging markets space is intriguing.  


Taiwan echo's that sentiment as it bases over the prior 10 month base.


Top Site hits of the of the week

My favorite links compiled over at See It Market

Biotech testing the most important level in the chart

12 Trading Thoughts

A short term hidden danger in solar ETFs

Lessons learned from years on twitter and stocktwits

Fallen Angels

The Sleeping Giant

Psyche

A few points worth noting: 

All week the bears glopped onto any weakness they saw and continually were steamrolled.  Stocks are in fine shape until that changes.

It seems like a lot of the biggest upside moves are coming off news and rumors.  The gut reaction has been to fade them and it's also not working.  

Range-bound characteristics are still shining in the stock market and leads us to still favor bounce trades over breakout trades.  

Be wary of the fear of missing out.  If/when we break the range higher, it's coming.  Particularly with sentiment polls showing decreasing levels of bulls.  

Select growth stocks are seeing some incredible action.  They're more rare these days so they stand out and lead to faster/stronger moves.  One current example is AMBA (no position).

It pays to know the time-frames of the folks you follow on social.  

Trade 'em well!

Reminder:

All ideas shown on this blog represent the authors opinion based on the data available.