The bulls reeled in suitcases of dead presidents while slow to adapt traders continue to die off. The bullish blog posts are flowing and rightfully so. In the last two weeks, vast waves of change have altered the market picture. Now, the defensive groups are testing support areas and we're getting hot readings from various indicators....but, the market has made it's intentions clear and it's best to run with the bulls until the market proves otherwise.
A quick recap
The monstrous wedge break in the Nasdaq 100 led the market rip.

Note the Small Caps are testing major resistance


Group Action
Energy has reached the top of the post-thanksgiving range.


Real Estate relative to Tech is testing the old breakout level. This happening while real estate hovers over the 50 day moving average.

The internet index broke out of this wedge we've been watching all year. If it sticks, bears should just go hibernate .

The spin-off ETF popped above year long resistance. Can it continue? It sure looks like financial engineering is another huge theme this year. For more information, here's the Guggenheim info page.

The stock bond ratio is awful close to trend resistance. The yield chase trade isn't dead, is it?

The consumer ratio is testing cloud resistance. Luckily it's a razor thin cloud and shouldn't be too much of an obstacle. It appears near term risk-off action will be another opportunity to get long.

Vol term structure is showing no fear in the market all of a sudden. WTF

The NYSE dashboard had a nice week and action is quite healthy across the board.

Once again the stock only advance decline line is above the upper bollinger band. The persistent strength is impressive, but like last week, this may signal we need to take another short term rest, at least from a breadth standpoint.

Interestingly, SPY short interest dropped sharply throughout the sideways correction. Is that just a function of year end tidying of positions? Honestly, I have no clue. So let's look further..
 |
| chart courtesy of schaeffersresearch.com |
 |
| chart courtesy of schaeffersresearch.com |
The anti-dollar trade is coming back into relevance here. I wrote on a whole bunch of related ideas a couple of weeks ago. The agriculture commodities remain favorite long ideas.
Is that a head and shoulders bottom in corn?

Is that a head and shoulders bottom in corn?
Nat Gas is testing it's 3 month downtrend. Price is making a higher low, maybe this bull momo divergence will start to matter.

Further Nat Gas Reading: @tradingonmark looks at the elliott wave count via @seeitmarket
Overseas
The world index broke over it's five month resistance line. Will it finally get going? Momentum supports a continued move higher. This makes for some real nice U.S. breakout confirmation.

The world index broke over it's five month resistance line. Will it finally get going? Momentum supports a continued move higher. This makes for some real nice U.S. breakout confirmation.
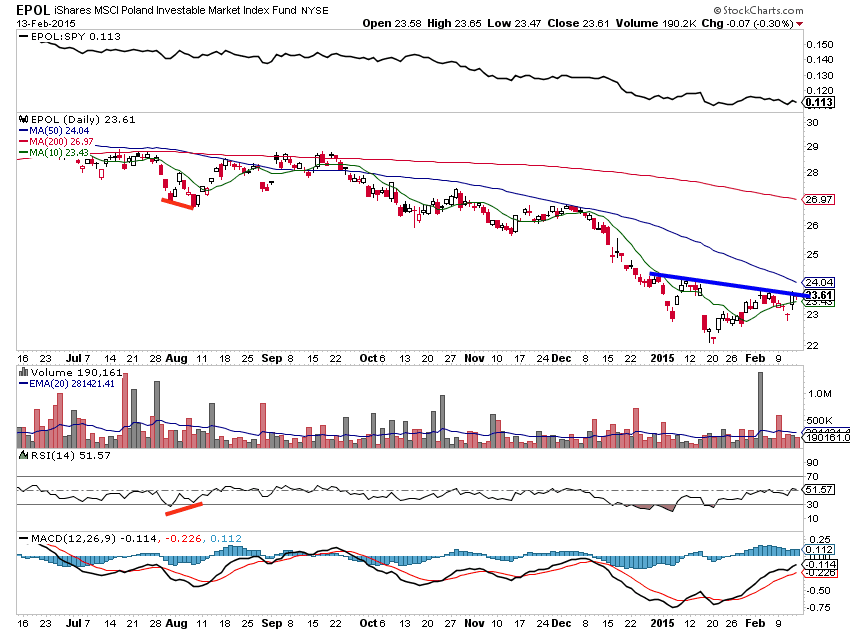
Poland is testing key short term resistance. The news flow from Russia and Greece will probably play a role. Also note the 50 MA nearby.
To summarize:
Just for emphasis, there might be some short term rest needed, but stocks are acting right and we're seeing everything bulls want to see as via Drasko Kovrlija
On top of that, the dollar appears is at key resistance, providing a possible boost to asset prices as Chris Kimble writes over at See It Market
Thanks for reading, have a great week!
No comments:
Post a Comment